
Lack of Access to Insurance
Access to affordable and reliable insurance is essential for protecting health, homes, vehicles, and financial stability. However, many individuals across the United States face barriers to obtaining insurance coverage due to high costs, geographic disparities, or structural inequities. The data sources below help users identify where insurance access gaps exist and how those gaps affect communities.
National data sources
KFF – The Uninsured Population and Health Coverage
The Kaiser Family Foundation (KFF) provides national research on health insurance coverage in the United States. This resource explains how Americans receive insurance through employer plans, government programs such as Medicaid and Medicare, and private markets. It also highlights the populations most likely to lack coverage.
Avaliable in this data set:
National uninsured rate (~8% of the population)
• Distribution of insurance coverage by type
• Demographic groups most likely to be uninsured
• State comparisons and policy differences
• Interactive maps showing uninsured rates by state
Instructions: Open the webpage → scroll through the article until you reach the data figures and tables → review the national statistics explaining how Americans obtain health insurance → locate Figure 6, which includes an interactive map of uninsured rates by state → select your state to see how its uninsured rate compares to national averages → review the demographic breakdowns discussed in the article to understand which populations experience the greatest insurance access gaps.
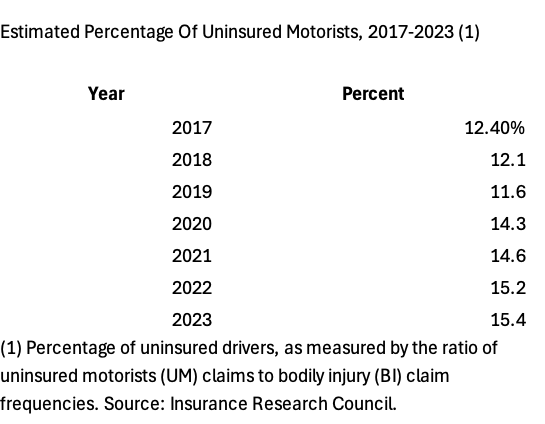
Insurance Information Institute – Uninsured Motorists
The Insurance Information Institute compiles national statistics on auto insurance coverage, including how many drivers operate vehicles without insurance. The dataset helps illustrate financial risks associated with uninsured drivers and shows how insurance access varies across states.
Avaliable in this data set:
• Percentage of uninsured motorists nationally (15.4% in 2023)
• State-by-state estimates of uninsured drivers
• Tables ranking states with the highest and lowest uninsured driver rates
• Minimum insurance liability requirements for each state
Instructions: Open the webpage → scroll down to the statistical tables provided on the page → locate the table listing estimated percentage of uninsured motorists by state → find your state within the table to see the estimated uninsured driver rate → compare your state to others to understand regional differences → review the additional table that lists state minimum insurance requirements to better understand what coverage drivers are legally required to carry.
Harvard Joint Center for Housing Studies – Insurance Affordability
This research article examines rising homeowners insurance costs and affordability challenges in the United States housing market. The article highlights how insurance premiums have increased in recent years and discusses how climate risks and market changes are affecting access to coverage.
Avaliable in this data set:
• National trends in homeowners insurance premiums
• Data showing a 74% increase in homeowners insurance since the Great Recession
• Information on a 20% increase in premiums between 2020 and 2023
• Research discussing how insurers are retreating from high-risk areas
Instructions: Open the article → read the overview explaining how homeowners insurance costs have changed nationally → review the statistics listed within the article describing premium increases and market trends → follow the research links within the article to explore additional housing affordability studies → use the information to understand how rising insurance costs can limit homeowners’ access to affordable coverage.

REGIONAL DATA SOURCES (Epa REGION 4)
The Southeast region faces growing challenges in accessing affordable and reliable insurance due to increasing climate risks, rising premiums, and gaps in coverage systems. Flooding, hurricanes, and extreme weather events disproportionately impact communities in states like South Carolina, while existing insurance structures often fail to provide adequate protection. As a result, lower-income and vulnerable populations are more likely to be uninsured or underinsured, limiting their ability to recover from disasters.
Federal Reserve – Flood Risk and Recovery Inequality
This dataset analyzes how flood risk and disaster recovery differ across communities, with strong relevance to the Southeast. Region 4 states such as South Carolina, Georgia, Florida, and Alabama face increasing exposure to flooding, hurricanes, and extreme rainfall, yet the ability to recover from these events is not evenly distributed. The research highlights how environmental risk, income, and insurance access intersect to shape recovery outcomes.
Instructions: Open the article → read sections discussing flood risk and recovery differences → identify how exposure varies by income level → locate data on properties outside FEMA flood zones → review insurance participation trends → connect findings to southeastern states → use this information to understand how insurance gaps increase long-term vulnerability
This Dataset Includes:
• Lower-income communities face higher flood exposure and slower recovery outcomes
• Many households in flood-prone areas lack flood insurance, increasing financial vulnerability
• Approximately 8.8 percent of properties outside FEMA flood zones still experience flooding
• Properties outside FEMA-designated zones are less likely to carry insurance due to lack of requirement
• Standard renters insurance does not cover flood damage, leaving renters highly exposed
• Disaster assistance is limited, often delayed, and frequently provided as loans rather than full recovery
• FEMA flood zone classifications do not capture all real-world flooding risks
Extreme Weather and Insurance Gaps in the Southeast
Across the Southeast, increasing exposure to extreme weather is creating growing gaps in insurance coverage. Coastal regions like Charleston experience frequent flooding from hurricanes, tidal events, and heavy rainfall, yet many households remain uninsured or underinsured. These gaps are shaped by affordability challenges, policy limitations, and differences in how risk is defined.
This Dataset Includes:
• Many households in flood-prone areas do not carry flood insurance, especially outside required zones
• Flood risk maps often fail to capture rainfall-based flooding, leading to underestimation of risk
• Disaster assistance is capped, limited, and often requires repayment, making it insufficient for recovery
• Insurance premiums are rising across the Southeast, reducing affordability
• Insurers are withdrawing from high-risk markets, limiting availability of coverage
• Renters are especially vulnerable because standard policies exclude flood damage
• Communities outside FEMA flood zones remain at risk but are less likely to be insured
Instruction:Open the link → review the regional sources → compare where flood risk is highest with where insurance coverage is lowest → examine how FEMA flood zone designations determine who is required to carry insurance → identify gaps between mapped flood risk and actual flooding events → consider how rising costs and insurer withdrawal limit access → use this to understand how environmental risk and affordability create unequal insurance protection across the Southeast
Environmental Defense Fund – Inclusive Insurance Project
This Dataset Includes:
Private insurers are raising premiums, increasing deductibles, or withdrawing from high-risk areas
Low- and moderate-income households are more likely to be excluded from traditional insurance markets
Case studies from South Carolina and other southeastern states highlight regional insurance gaps
Public-private partnerships are being developed to expand access and reduce financial risk
Mitigation programs incentivize home upgrades to lower damage risk and insurance costs
Parametric insurance models provide faster payouts based on disaster events rather than assessed damage
Research includes insights from policymakers, insurers, and climate justice organizations
This dataset explores how insurance systems are evolving in response to increasing climate-related risks, particularly in disaster-prone regions like the Southeast. As flooding, hurricanes, and extreme weather events become more frequent, traditional insurance markets are becoming less accessible. The resource focuses on improving insurance access for communities that are underserved by existing systems.
Instructions: Open the website → scroll to reports and publications → select a report on disaster insurance or climate resilience → review southeastern case studies → examine differences in affordability and access → identify policy recommendations and new insurance models → use findings to understand how insurance systems are adapting to climate risk
LOCAL DATA SOURCES (SOUTH CAROLINA / CHARLESTON)
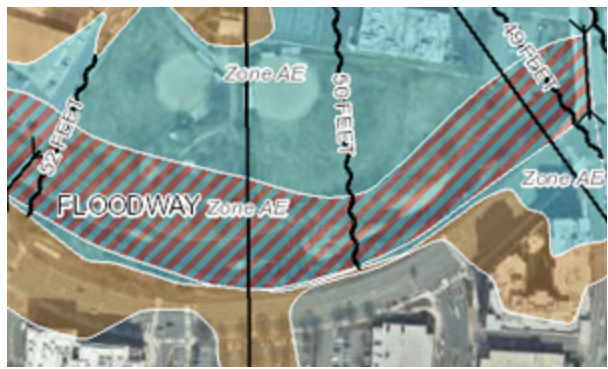
FEMA Flood Map Service Center
This tool allows users to view official FEMA flood zone maps, which determine flood risk classifications and whether flood insurance is required for a property. In coastal areas like Charleston, these maps play a major role in shaping who is required to carry insurance, even though many properties outside designated zones still experience flooding.
This Dataset Includes
• Official FEMA flood zone designations for specific properties
• Identification of Special Flood Hazard Areas (SFHAs)
• Flood risk categories used to determine insurance requirements
• Map layers showing coastal and inland flood risk
• Property-level search for flood zone status
• Base flood elevation data in some areas
• Tools used by insurers, lenders, and policymakers
Instructions: Open the link → enter a Charleston address or ZIP code → view the flood zone designation → identify whether the property is in a Special Flood Hazard Area → compare mapped risk with known local flooding → use this to understand how insurance requirements are determined and where gaps exist
ACS Table S2701 – Health Insurance Coverage Status
This Dataset Includes
• Percent uninsured by age group
• Coverage types including employer, Medicaid, Medicare, and private plans
• Data by race, income, and employment status
• State, county, and census tract level estimates
• Comparisons between local, state, and national coverage rates
• Breakdown of public versus private insurance coverage
• Indicators of disparities across populations
Instructions: Open the table → search Charleston County or South Carolina → select your geography → review uninsured rates across demographic groups → compare with state and national averages → use this to identify local insurance access gaps.
ACS Table S2701 – Health Insurance Coverage Status
This dataset provides detailed local-level data on health insurance coverage, allowing users to examine uninsured rates across South Carolina and Charleston County. It helps identify which populations face the greatest barriers to accessing medical insurance.