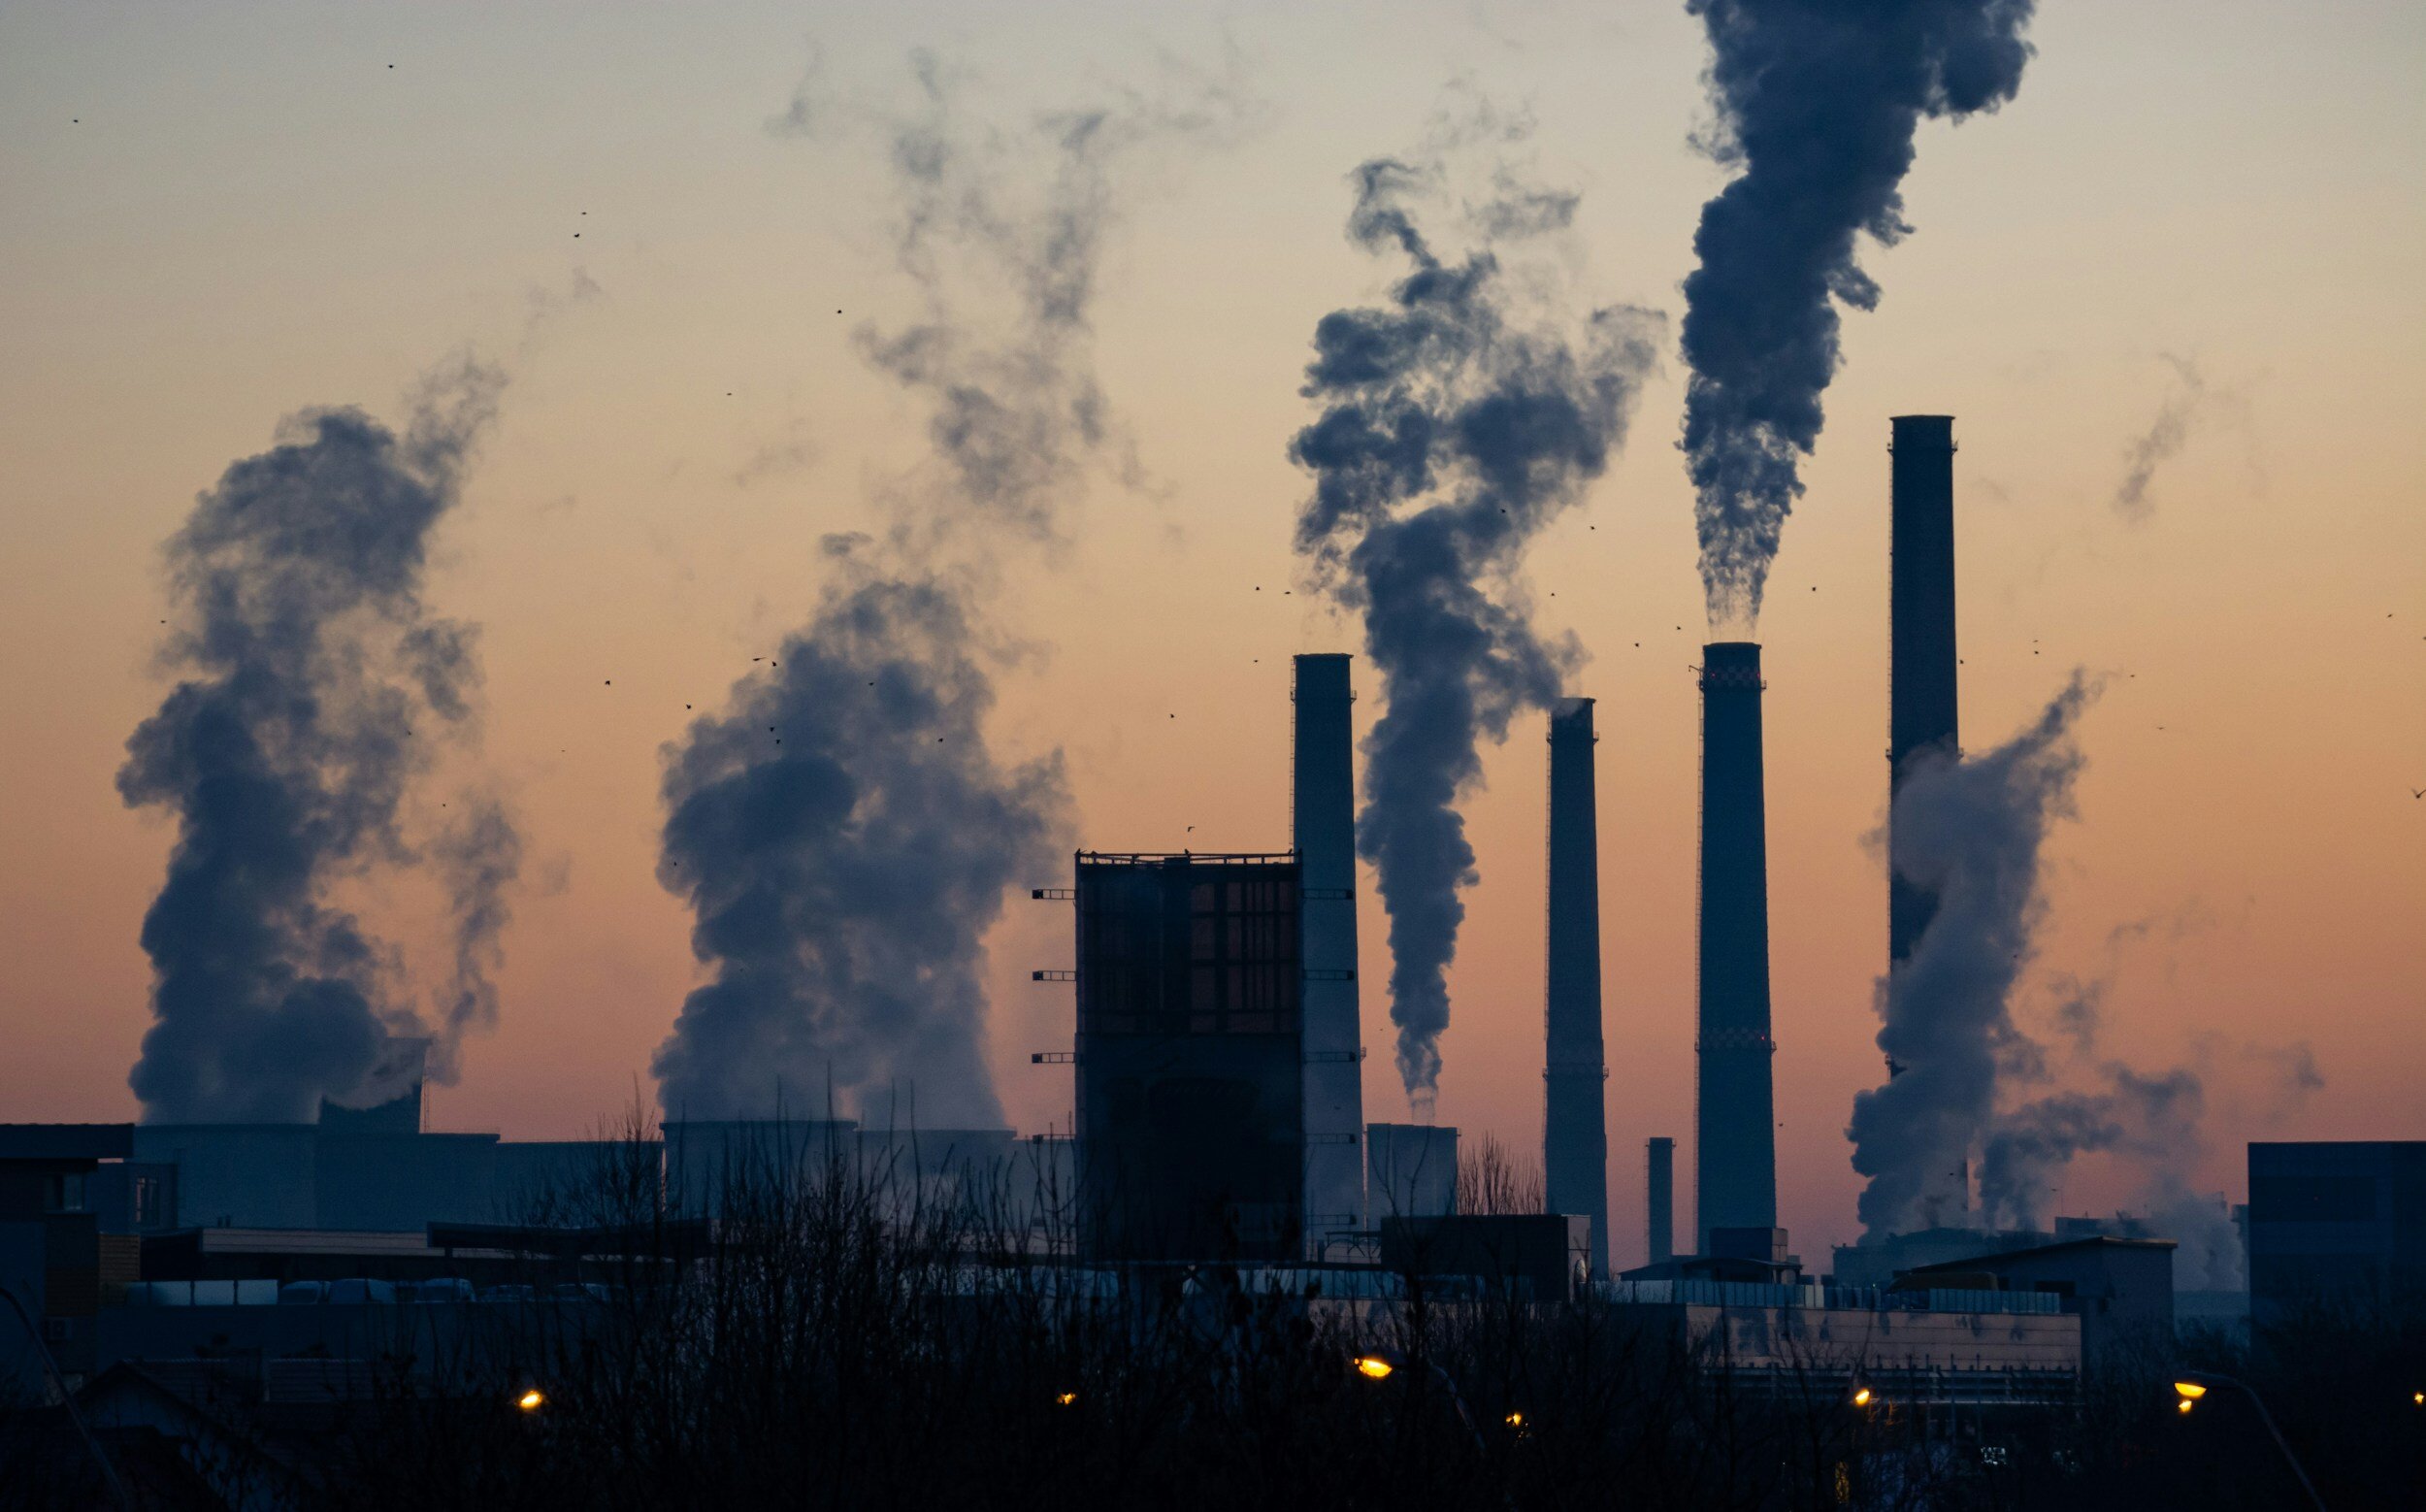
exposure TO air pollution
People have a right to protection from chronic exposure to pollutants in their outdoor environment. Below you can find data sources to help determine your exposure levels.
Air pollution is the contamination of the air by any chemical, physical, or biological agent. Fossil fuel combustion is a leading cause of poor air quality, which is associated with a range of negative health effects. The 1970 Clean Air Act (CAA) empowers the EPA to establish the NAAQS (National Ambient Air Quality Standards) to protect public health and welfare. Regulations of emissions, including Criteria Air Pollutants (CAPs) and Hazardous Air Pollutants (HAPs) are set by the EPA.
See EPA—Clean Air Act.
Criteria Air Pollutants
CAPs are widespread throughout highly-populated areas in the U.S. and considered relatively safe at low exposure levels. The Clean Air Act dictates levels of release that are considered safe, but increased levels are harmful to humans and the environment. These pollutants include ozone, particulate matter, carbon monoxide, sulfur dioxide, nitrogen oxides, and lead. Though the EPA sets these standards, states are responsible for developing State Implementation Plans (SIPs) to achieve and maintain compliance with these.
Click each pollutant below to learn more.
-
Carbon monoxide (CO) is a colorless, odorless gas that can be harmful when inhaled. It is released when something is burned.
SOURCES: CO primarily comes from cars, trucks, and other machinery that burn fossil fuels (oil, gasoline, coal, and natural gas).
HEALTH EFFECTS: CO reduces the amount of oxygen that can be transported in the bloodstream to critical organs, such as the heart and brain. When breathed in very high levels (typically in enclosed environments), CO can cause dizziness, confusion, unconsciousness, and death. Levels required for these effects are rare outdoors, but outdoor exposure can still be harmful for people with heart or lung problems, or people who are exercising.
ENVIRONMENTAL EFFECTS: CO is a significant contributor to ground-level ozone and smog.
-
Lead is a metal found in the earth’s crust that has some beneficial uses, but is toxic even in small amounts, especially to children.
SOURCES: It is emitted from a variety of human processes, such as metal processing, aircraft use of leaded fuel, waste incinerators, electric utilities, and lead-acid battery manufacturing. The highest concentrations are usually found near lead smelting facilities. There are also traces of lead inside houses with lead-based paint (especially if it is deteriorating), which was banned by the EPA in 1978.
Lead dust can be inhaled, and traces of lead can be ingested if a person drinks water that has passed through lead pipes, or eats or drinks with dishes or glasses containing lead.
HEALTH EFFECTS: Lead accumulates in the bones once it enters the body. It can have a range of negative health effects on the kidney function and nervous, reproductive, immune, and cardiovascular systems.
Lead is particularly dangerous to children. Their bodies absorb more lead than adults’, and are more sensitive to its damage. Lead exposure can result in behavioral problems, learning deficits, slowed growth, hearing issues and anemia. Lead exposure in pregnant women can result in similar effects for the fetus, and can increase the probability of miscarriage.
ENVIRONMENTAL EFFECTS: Lead in soil and water can result in decreased growth and reproduction in plants and animals, and can affect the nervous system of vertebrates.
-
SOURCES: Nitrogen dioxide primarily enters the air through the burning of fossil fuels from cars, trucks, buses, power plants, and industrial processes.
HEALTH EFFECTS: Exposure to high concentrations of nitrogen dioxide in the air can aggravate respiratory diseases such as asthma, and can lead to coughing or difficulty breathing. Nitrogen dioxide is also a component of particulate matter and ozone (smog).
ENVIRONMENTAL EFFECTS: Like sulfur dioxide, nitrogen dioxide is a component of acid rain.
Nitrogen dioxide and other forms of nitrogen are key components of nutrient pollution in water bodies (along with phosphorus). Nutrient pollution is a widespread problem in the United States. It occurs when an excess of nutrients enter water bodies and cause excessive growth of algae. This blocks sunlight that is needed for plants in the water to grow, which kills them. Their decay process uses oxygen from the water, which kills animals in the water food chain that rely on oxygen.
-
There is “good” and “bad” ozone. According to the EPA, “good ozone occurs naturally in the upper atmosphere, where it forms a protective layer that shields us from the sun’s harmful ultraviolet rays.” Click here to learn more about good (stratospheric) ozone. However, ozone at ground level is harmful.
SOURCES: Ground level ozone is created when pollutants from cars, power plants, industrial boilers, refineries, chemical plants, and other sources chemically react in the presence of sunlight. It is most likely to reach unhealthy levels on hot, sunny days in urban areas, but it can still do so during colder months.
HEALTH EFFECTS: Ground-level ozone can cause coughing, sore throat, difficulty breathing deeply, and airway inflammation. It can make the lungs more susceptible to infection and aggravate lung diseases such as asthma, emphysema, and chronic bronchitis. Ozone is the main ingredient in smog.
ENVIRONMENTAL EFFECTS: For certain plants, ozone can reduce growth and increase risk of disease, risk of damage from insects, risk of damage from other pollutants, and risk of harm from severe weather.
-
Particulate matter (PM) is a mixture of solid particles and liquid droplets in the air. Examples include dust, dirt, soot, and smoke, among others. They are classified by size. PM 10 are particles that are 10 micrometers wide and smaller, while PM 2.5 are even finer particles that are 2.5 micrometers wide and smaller (about 30 times smaller than the diameter of one human hair).
SOURCES: Particulate matter can originate from single sources such as construction sites, unpaved roads, smokestacks, power plants, industrial sites, and cars, or can be created by complex reactions of chemicals emitted from multiple sources.
HEALTH EFFECTS: Due to its small size, PM can be inhaled, can penetrate deep into the lungs or even the bloodstream, and can cause serious health issues. PM 2.5 particles have the greatest health risks. These risks include premature death in people with heart and lung disease, heart attacks, irregular heartbeat, aggravated asthma, decreased lung function and airway irritation, coughing, or difficulty breathing.
ENVIRONMENTAL EFFECTS: PM can be carried long distances by wind and can make water bodies acidic and change their nutrient balance, deplete soil nutrients, damage forests and farm crops, and contribute to acid rain (see Sulfur Dioxide section below for an explanation of acid rain).
-
SOURCES: Sulfur dioxide is both released naturally by volcanic activity and produced as a byproduct of copper extraction and the burning of fossil fuels. The largest sources are power plants and other industrial facilities. Smaller sources include metal smelting and cars and ships that burn fuel containing sulfur.
HEALTH EFFECTS: Exposure to sulfur dioxide can harm the respiratory system, make breathing difficult, and aggravate asthma. Sulfur dioxide is a component of particulate matter.
ENVIRONMENTAL EFFECTS: High concentrations of sulfur dioxide can decrease tree and plant growth. It also contributes to acid rain, which can be fatal to species in the water and on land that cannot tolerate acidic conditions. For example, acidic water can both kill adult fish and prevent fish eggs from hatching, thus killing off fish in that water body. On land, it can kill forests by causing aluminum to be released from the soil.
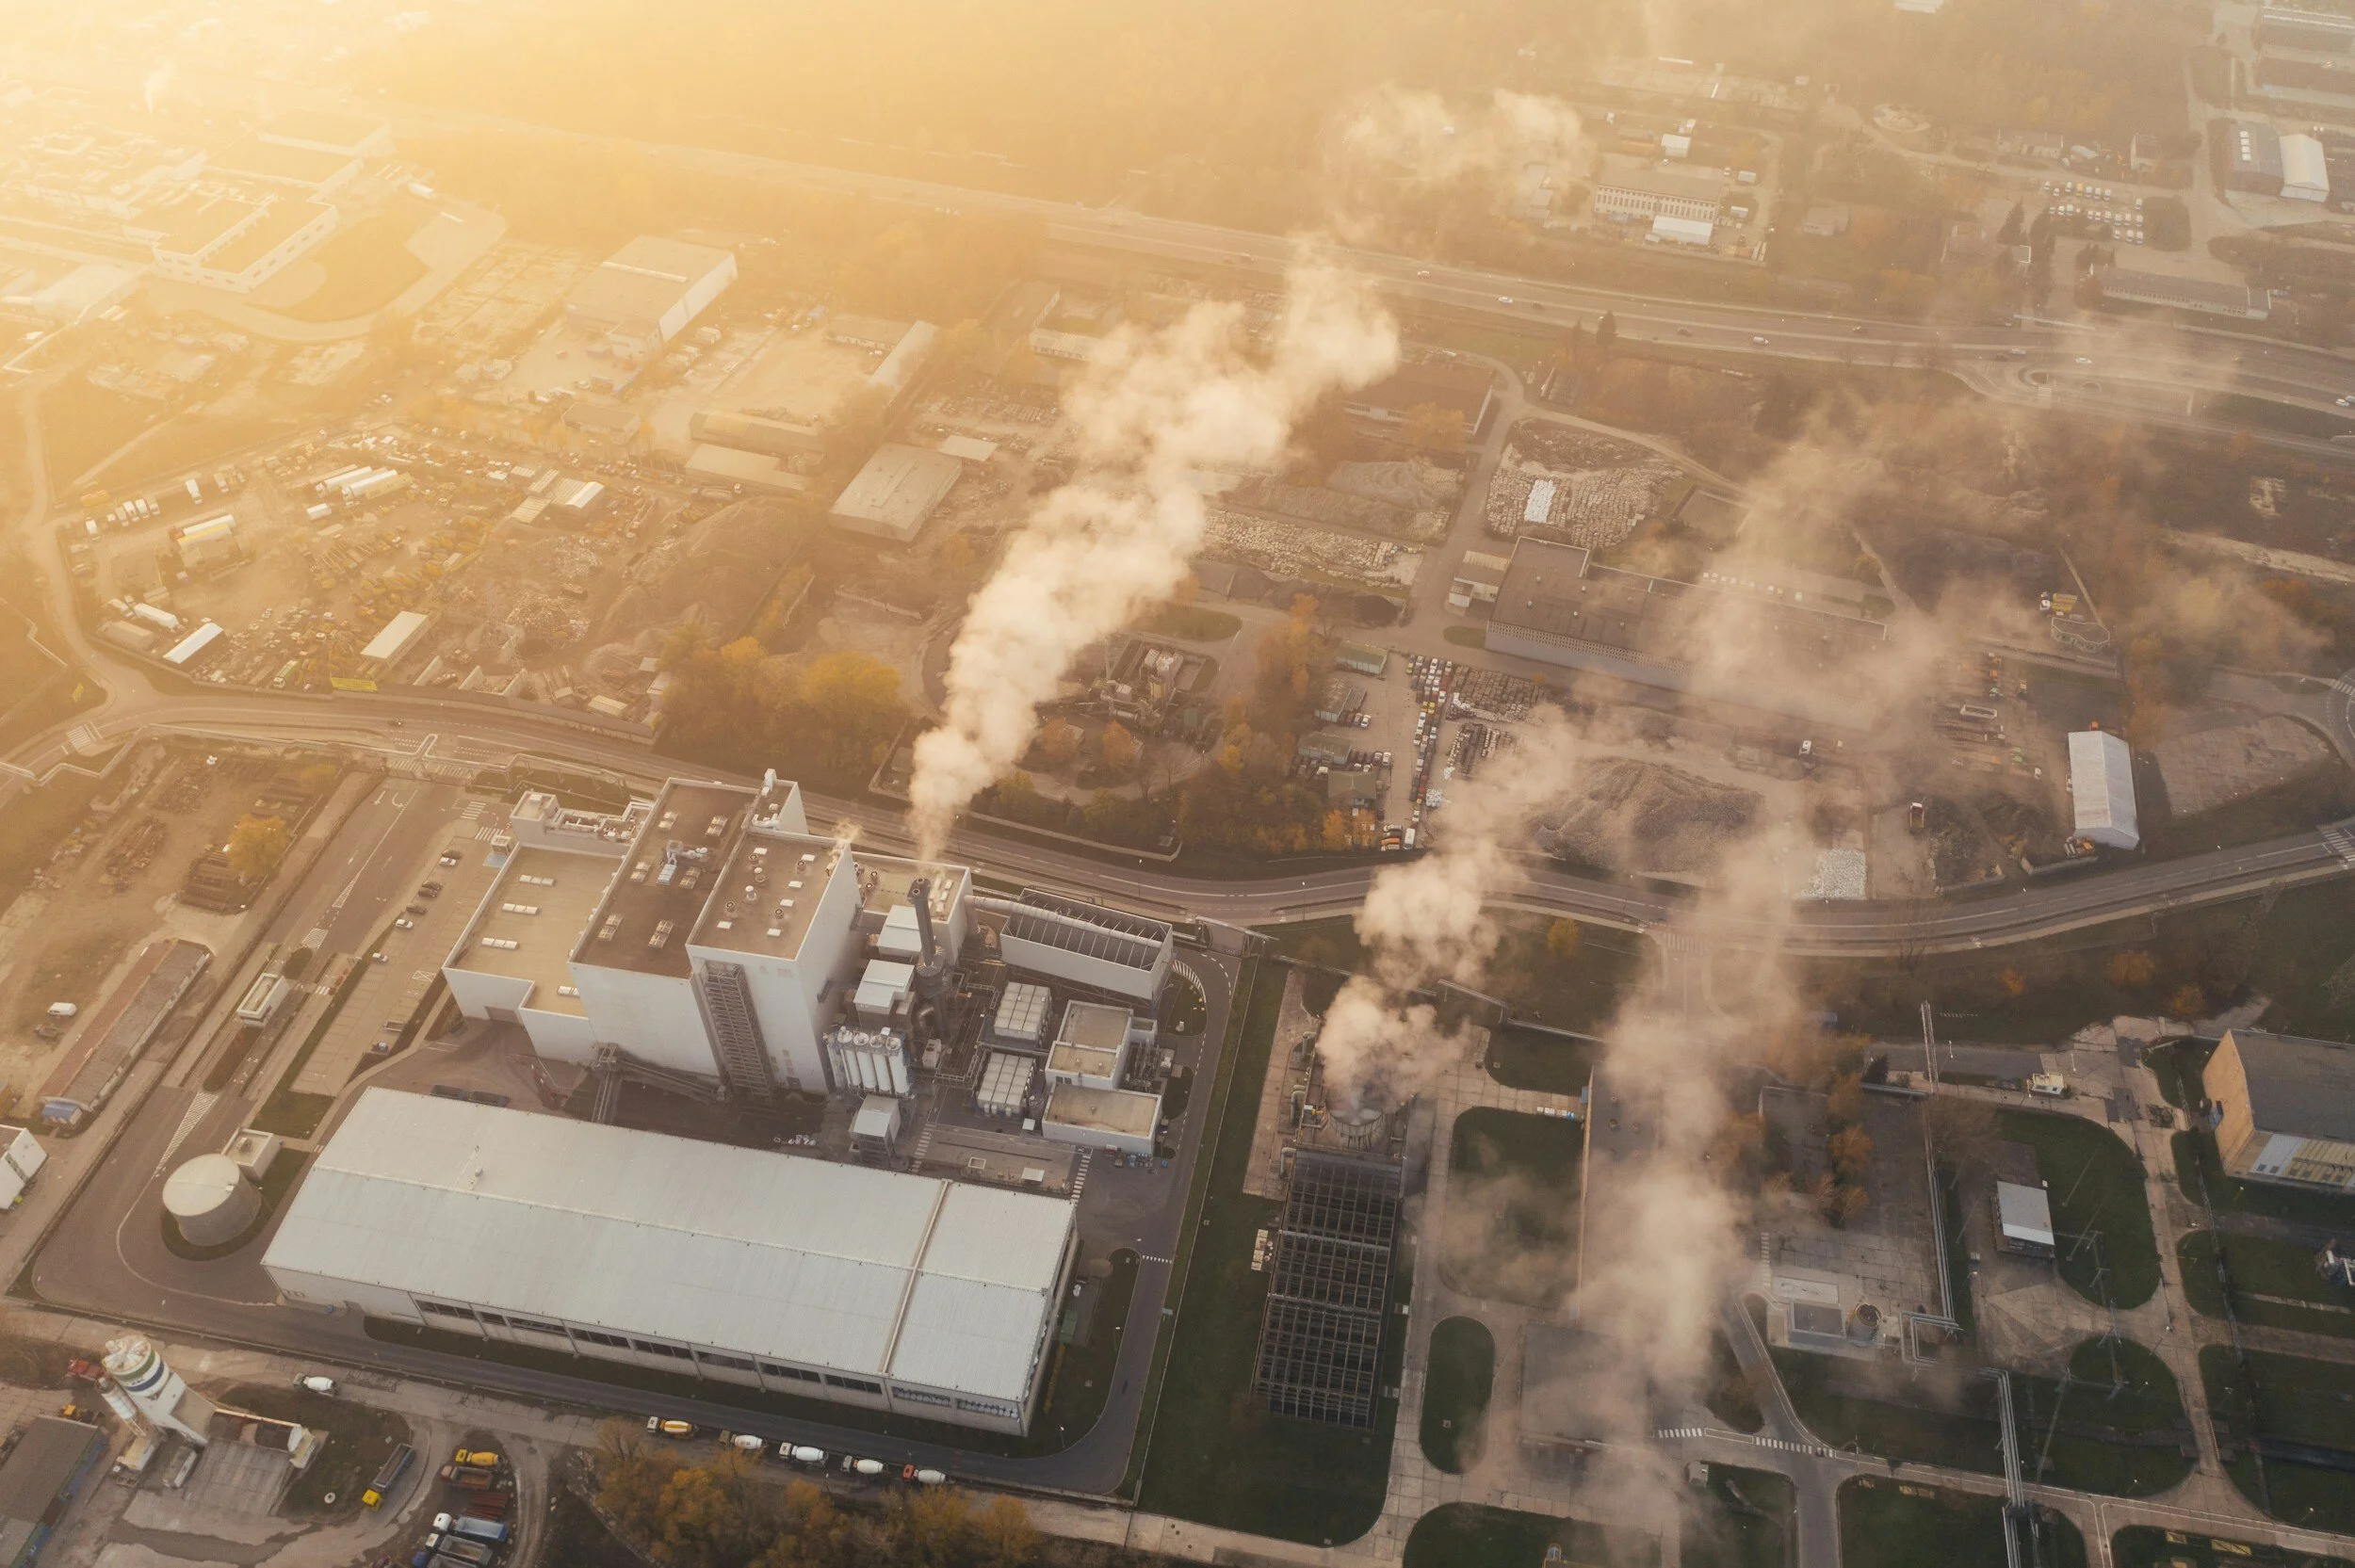
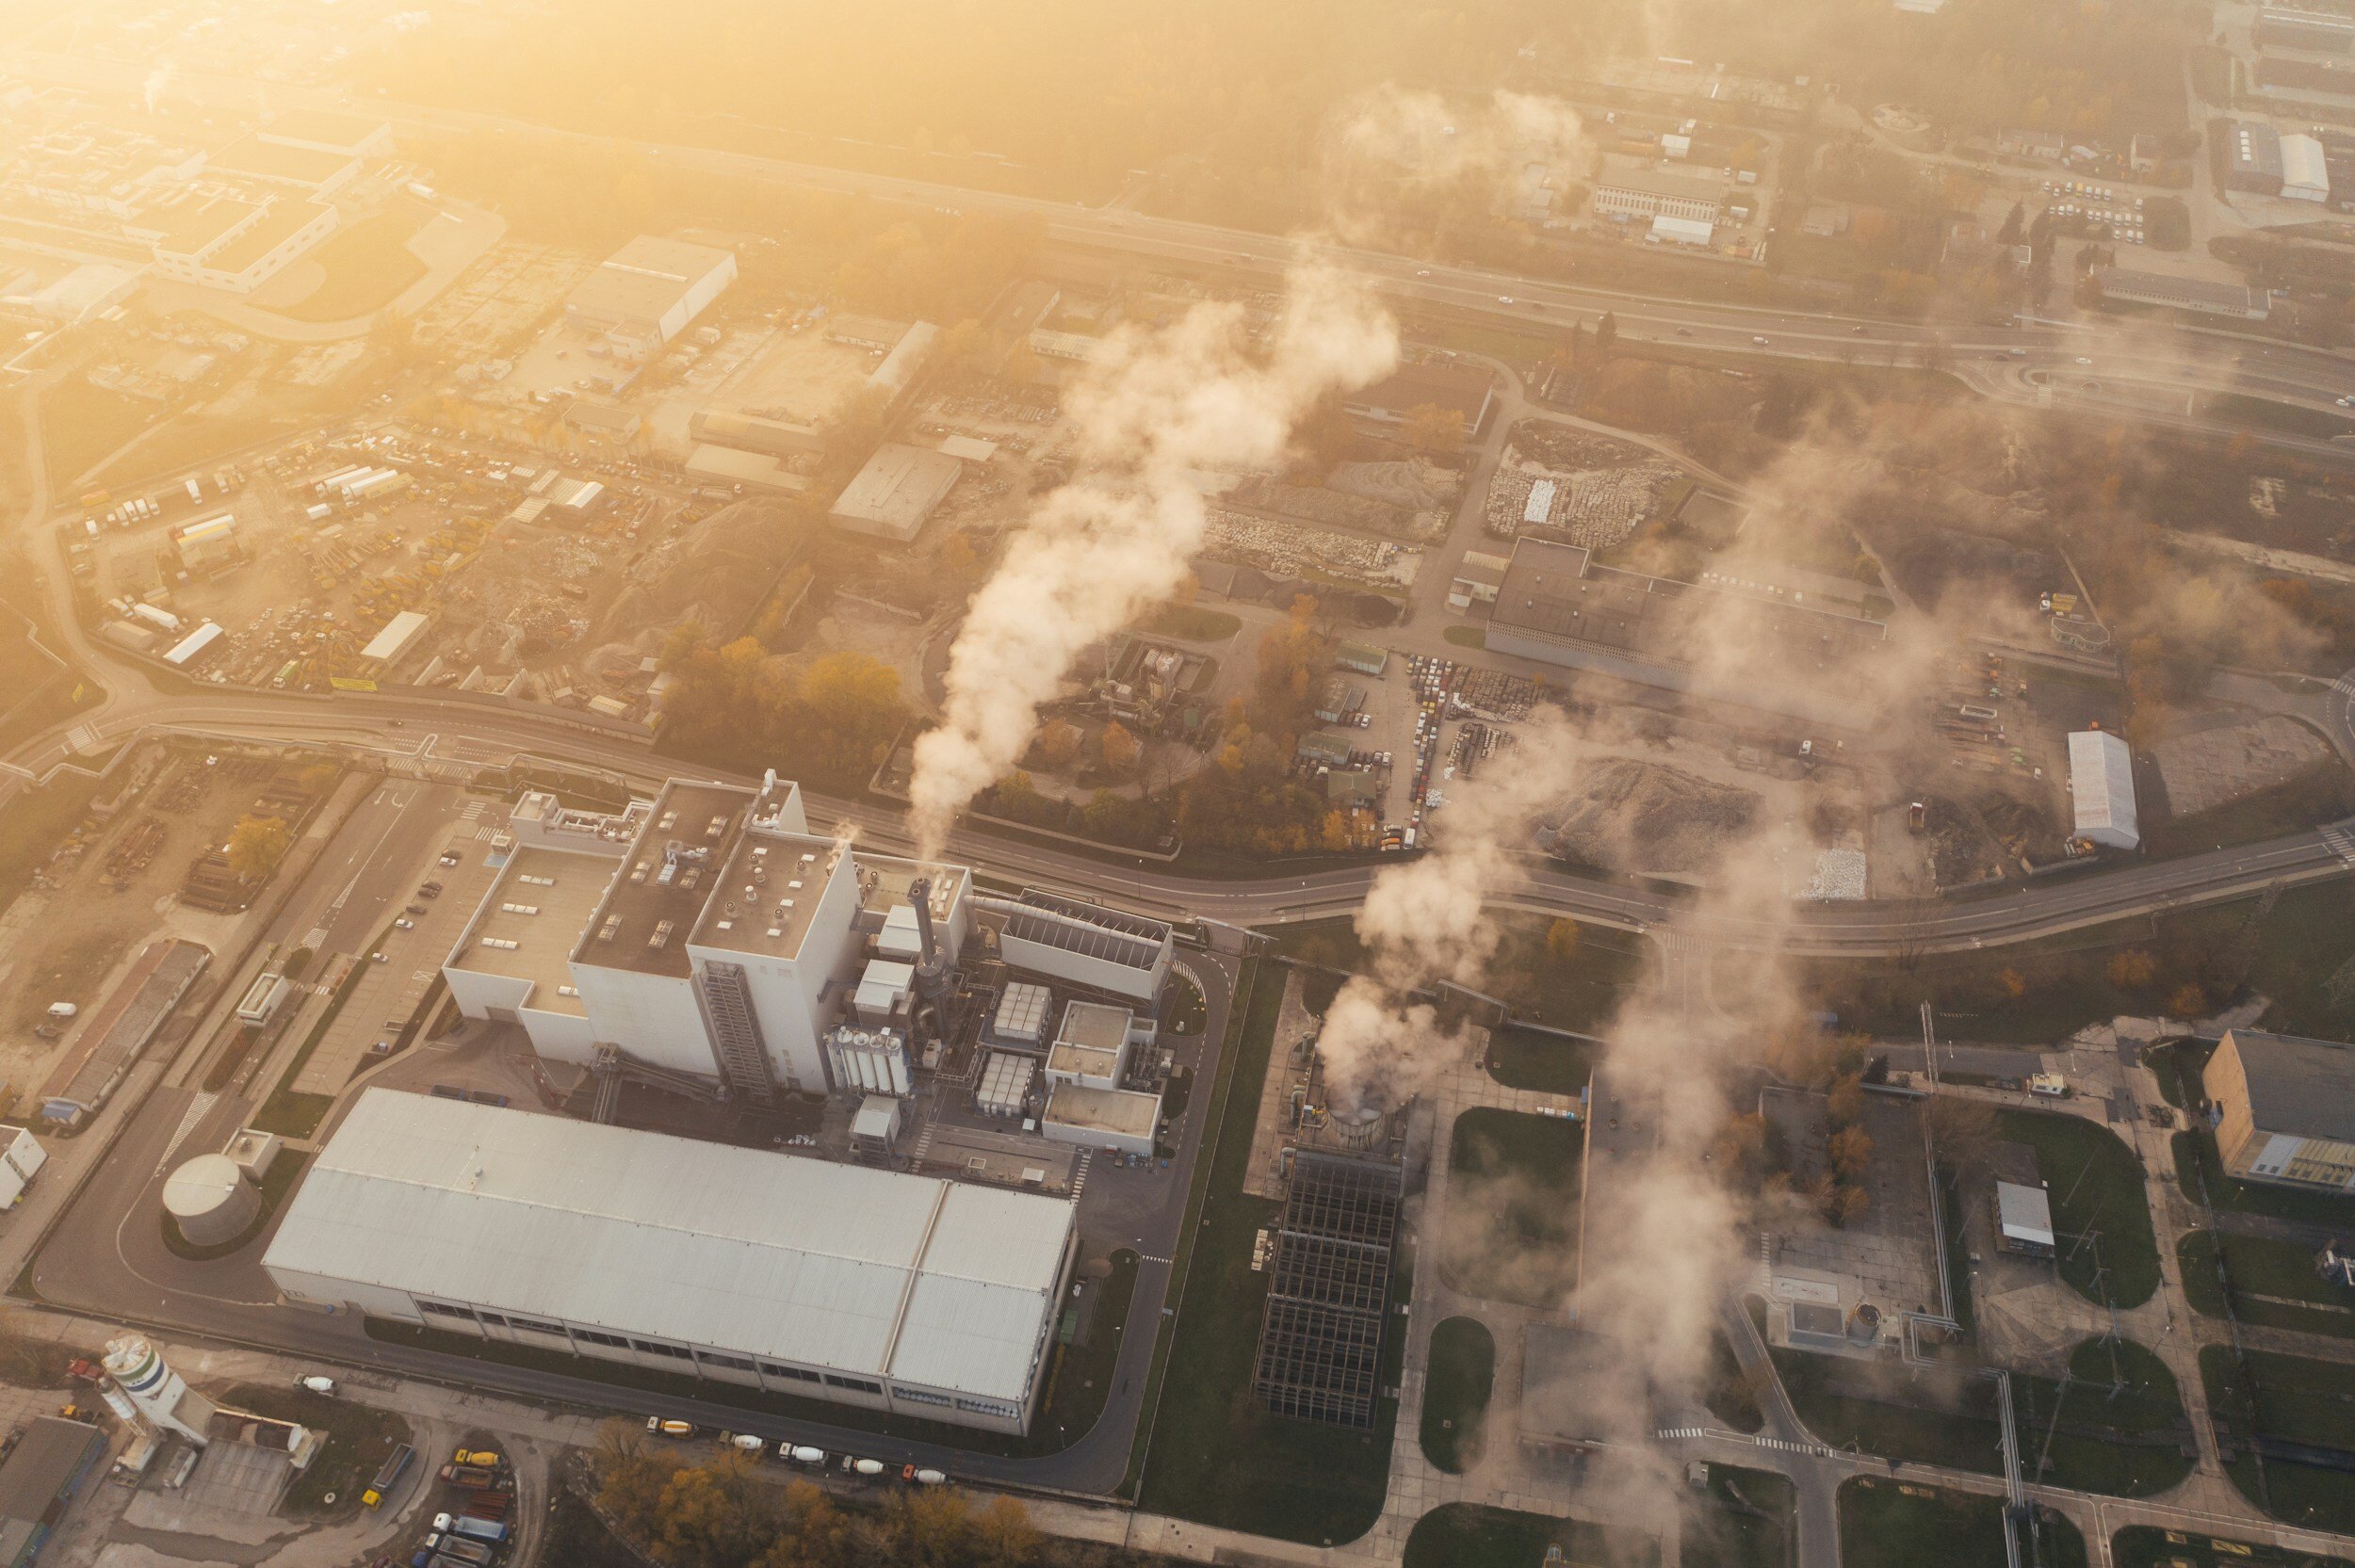
The EPA Air Quality Index gives you a single daily average number to indicate your city’s air quality. This number encompasses all pollutants mentioned above, based on measurements taken from the nearest air monitor station. The pollutant with the highest number (the most unsafe levels) determines the air quality index number.
EPA AQI Instructions: Open Tool > Type your zip code, city, or state in the search bar, and click the magnifying glass. > A number will be generated to tell you the average level of air quality in your area that day.
The AQI has limited precision. It does not tell you about air quality specific to a particular neighborhood or group of neighborhoods. It also does not tell you which pollutants are contributing. You can look at raw data from an air quality monitor to investigate that.
OpenAq is a global map that compiles air quality data from ground stations installed and managed by governments, nonprofits, and citizens. The following 2 types of ground monitors are included:
Reference monitors (purple dots with white outlines) are high quality monitors most often used by governments and researchers.
Air sensors (purple dots without white outlines) are monitors that are limited in accuracy, but more accessible. These can help expand reach of ground stations and increase the data available.
Many areas are not within close proximity to a ground monitor. Purchasing your own sensor, or advocating for sensors close to your community can increase the specificity of data.
Sensors can be purchased and installed through Purple Air. Locations where air sensors may be useful include areas close to likely sources of pollution, to give you an idea of how bad air quality might be in those areas and areas not close to other sensors, but still in or near developed areas where pollution may exist.
OpenAq Instructions: Open Tool > Click on the search bar and type in your city. A dropdown list should appear > Click on your city > Purple dots represent air stations > Click on one > On the right, you will see which pollutants this station measures > Scroll to the bottom of the window and click Show Details. Scroll down to see a line graph of recent pollution readings from the station.
Choose a pollutant to examine by clicking the dropdown list under Latest Readings. The time window can be changed using the Last 24 Hours dropdown. It may be helpful to examine both Last 1 Week and Last 30 Days to determine patterns (i.e., PM 2.5 is typically highest during rush hour when there are lots of cars in the area).
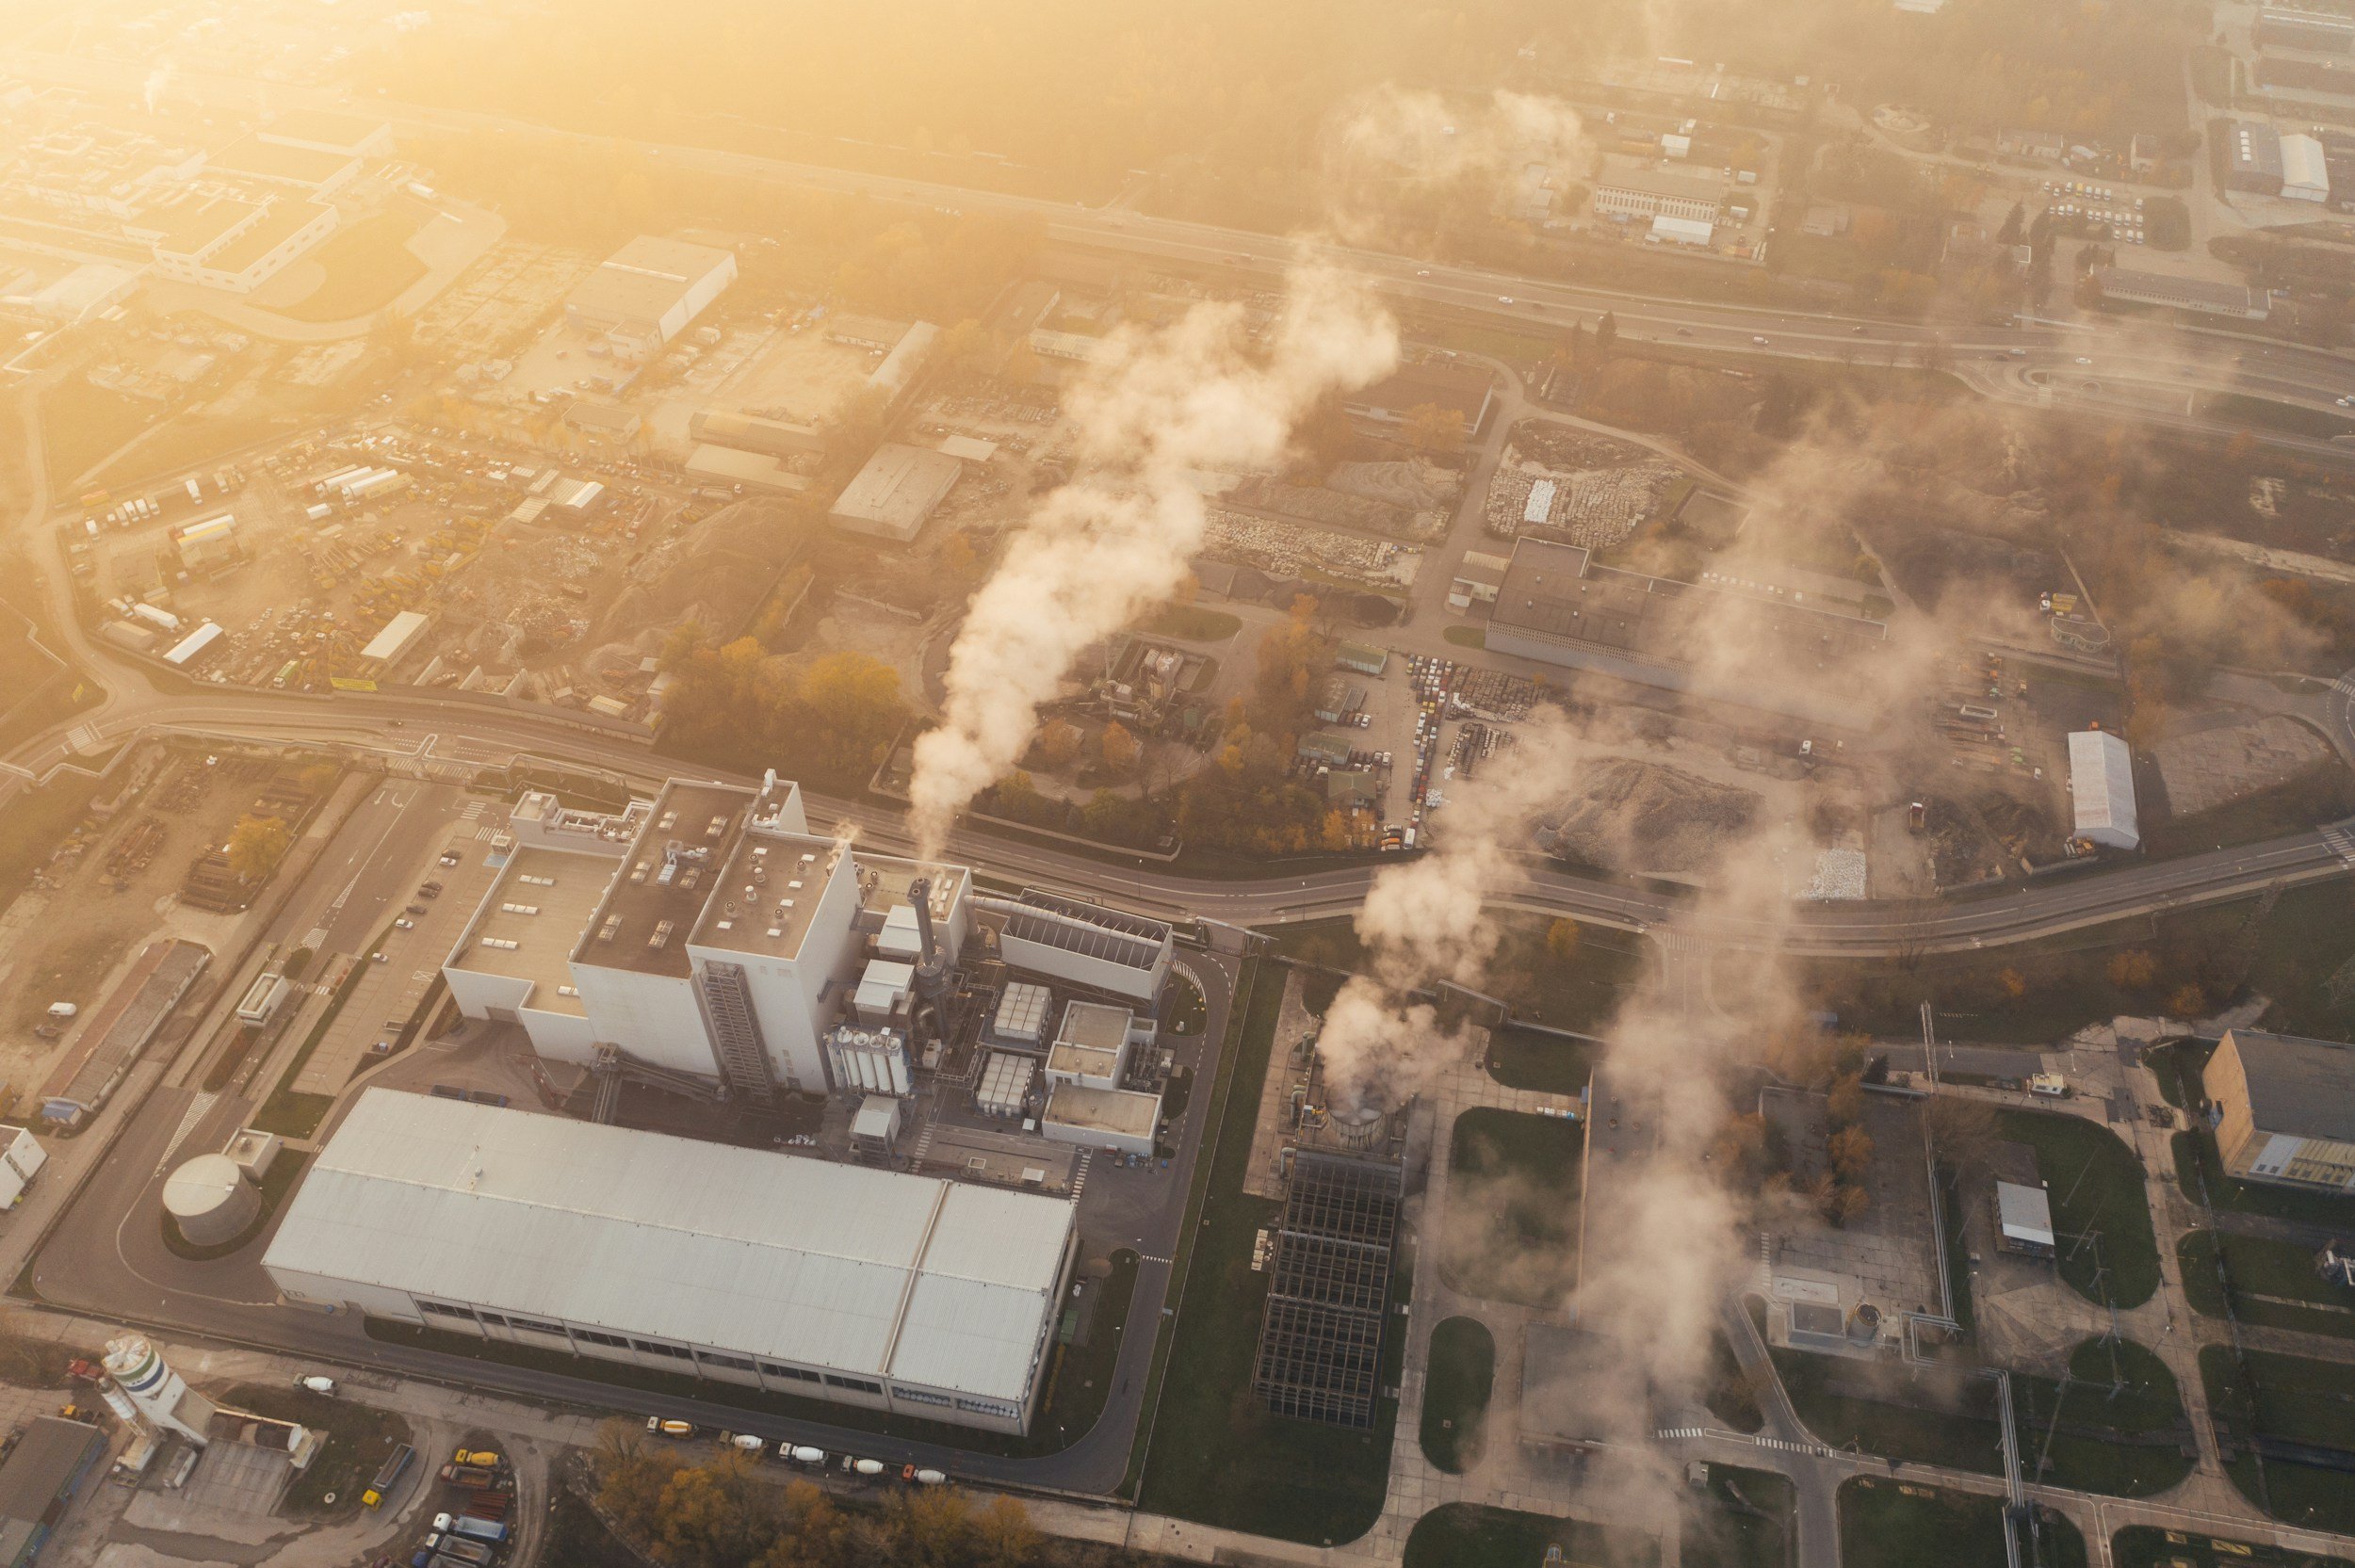
Hazardous Air Pollutants
HAPs are 188 pollutants identified by the EPA, in accordance with the Clean Air Act, as particularly harmful to human health. No level of HAP exposure is safe. Negative health effects include developmental and reproductive issues, neurological disorders, and heritable gene mutations.
-
A known human carcinogen, benzene is primarily emitted from industrial processes and motor vehicle exhaust. It poses significant health risks, including leukemia and other blood disorders.
-
Found in various household products and emitted from industrial sources, formaldehyde is a respiratory irritant and a probable human carcinogen.
-
Emitted primarily from coal-fired power plants, mercury can accumulate in the environment and bioaccumulate in the food chain, posing risks to neurological development, particularly in fetuses and children.
-
Emitted from industrial processes such as mining and smelting, arsenic exposure can lead to various health problems, including cancer, cardiovascular disease, and skin lesions.
-
Found in combustion processes such as vehicle exhaust and industrial emissions, PAHs are carcinogenic and pose risks to human health, particularly respiratory and cardiovascular systems.
-
A group of highly toxic compounds formed as byproducts of combustion processes, such as waste incineration and certain industrial activities. Dioxins are carcinogenic and can cause reproductive and developmental issues
The EPA AirTox Screen tool shows area risk as a result of HAP exposure, the pollutants driving these risks, and emission sources. Risks are categorized into the following:
Biogenic: from natural sources such as trees, plants, and soil microbes.
Stationary point: from stationary man-made sources, such as factories.
Secondary: from the reaction of pollutants emitted by humans with natural chemicals in the air, mostly from fossil fuel burning.
Background: from pollutants remaining in the environment from prior emissions, long range transport of pollutants from distant sources, and some natural sources not included in the biogenic calculation.
EPA AirTox Screen Instructions: Open Tool > Type address, zip code, or city in the search bar and click the magnifying glass > Shades of blue show the cancer risk to people in the area from air pollutants. Darker blue= higher risk (shown in the legend at the right). The numbers in the legend show for every million people, the number that are likely to get cancer if they lived in that area for 70 years.
Click an area of the map to see more information. The Risk by Air Toxic pie chart shows you which pollutants are contributing the greatest risk. The Risk by Source Type chart shows you what kinds of sources the pollutants are coming from. You can investigate the risk of other health issues by clicking the tab 2019 Noncancer Hazards at the top.
Additional Resources
EPA Office of Air & Radiation (OAR): develops national programs, policies, and regulations for controlling air pollution and radiation exposure in accordance with the Clean Air Act.
EPA National Emissions Inventory (NEI) Data Retrieval Tool: National compilation of air emission estimates of CAPs and HAPs with an inventory of facilities and counties. Users can examine emission estimates for specific pollutants from specific source types for local to national geographical areas.
EPA Toxics Release Inventory (TRI): Tracks industrial management of harmful toxic chemicals, reported by certain industrial and federal facilities. Multiple online tools are available within this.
Justice40 Legacy Pollution Disadvantaged Tracts: Interactive web map that allows user to identify areas considered burdened by legacy pollution at the census tract level.