
Upward Mobility, Transportation & Leisure Access
People have a right to access opportunities that support personal growth, economic advancement, recreation, cultural exposure, and quality of life. These opportunities can include strong schools, job pathways, transportation, health care, parks, recreation, sports, travel, youth programs, trade programs, and cultural experiences. This page helps users identify where these opportunities exist, where access gaps appear, and whether barriers such as income, transportation, geography, race, age, or neighborhood conditions limit participation.
Upward mobility Data Sources
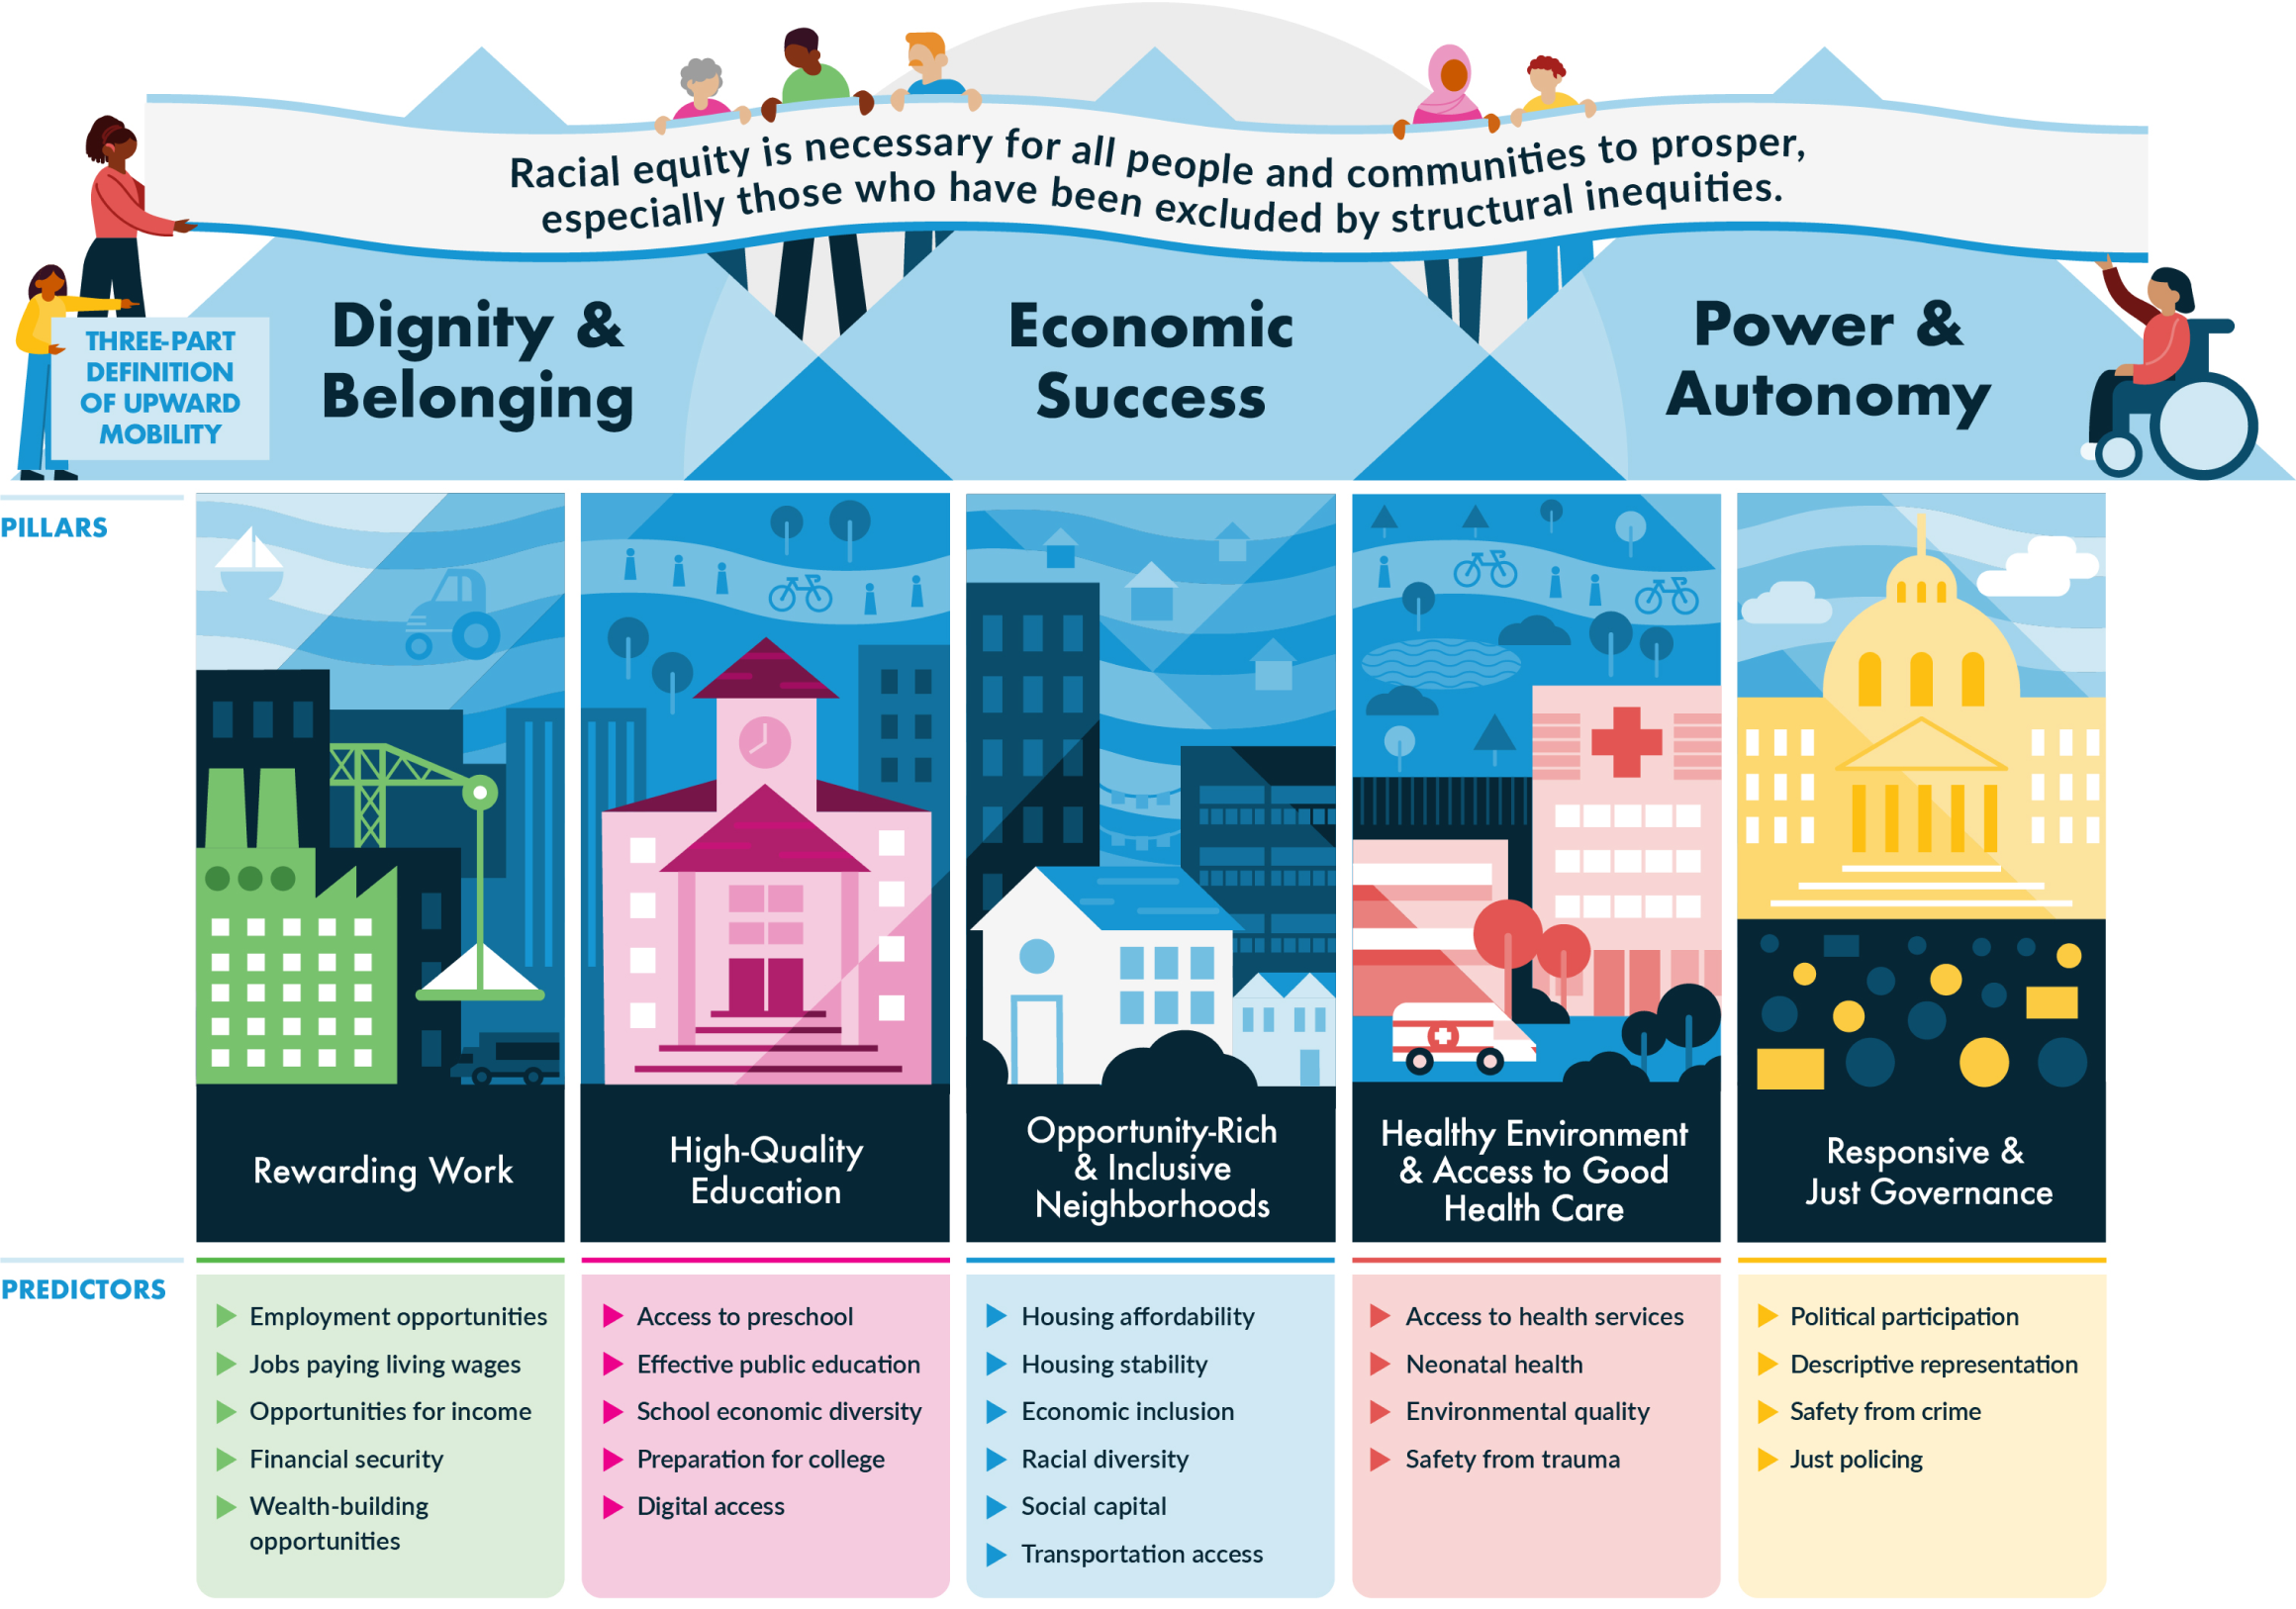
Urban Institute — Upward Mobility Initiative Data Dashboard
The Urban Institute’s Upward Mobility Dashboard provides city- and county-level data on the conditions that support upward mobility. It organizes opportunity into five major pillars: rewarding work, high-quality education, opportunity-rich neighborhoods, healthy environments and health care, and responsive governance.
What’s in this dataset/tool:
24 upward mobility predictors
County-level data
Data for more than 480 U.S. cities
Five major mobility pillars
Community comparison tools
High-quality education maps
Employment statistics
Expanded data cards with detailed information
Instructions: Open tool > scroll down to search for specific communities > type in a county or city of interest > select desired pillars > open predictors using the black down arrow > check or uncheck indicators > click the blue search bar at the bottom > click “expand card” for more details.
AARP Livability Index
The AARP Livability Index evaluates how livable a community is across categories such as housing, neighborhood, transportation, environment, health, engagement, and opportunity. It is useful because it connects mobility, access, community resources, and quality of life.
What this tool shows:
Community livability scores.
Mobility and transportation indicators.
Neighborhood access.Health and environmental indicators.
Engagement and opportunity scores.
Demographic and map-based comparisons.
What’s in this dataset/tool:
Overall livability scores.
Category scores for housing, transportation, health, environment, engagement, and opportunity.
Map layers.
Community demographics.
Street-level and neighborhood-level views.
Comparison tools.
Instructions: Open tool > search for a city, county, or address > review the overall livability score > examine categories such as transportation, opportunity, health, and neighborhood access > use map layers to compare nearby areas > click specific locations for more detailed scores.
Opportunity Atlas — Mapping Economic Mobility Across the U.S.
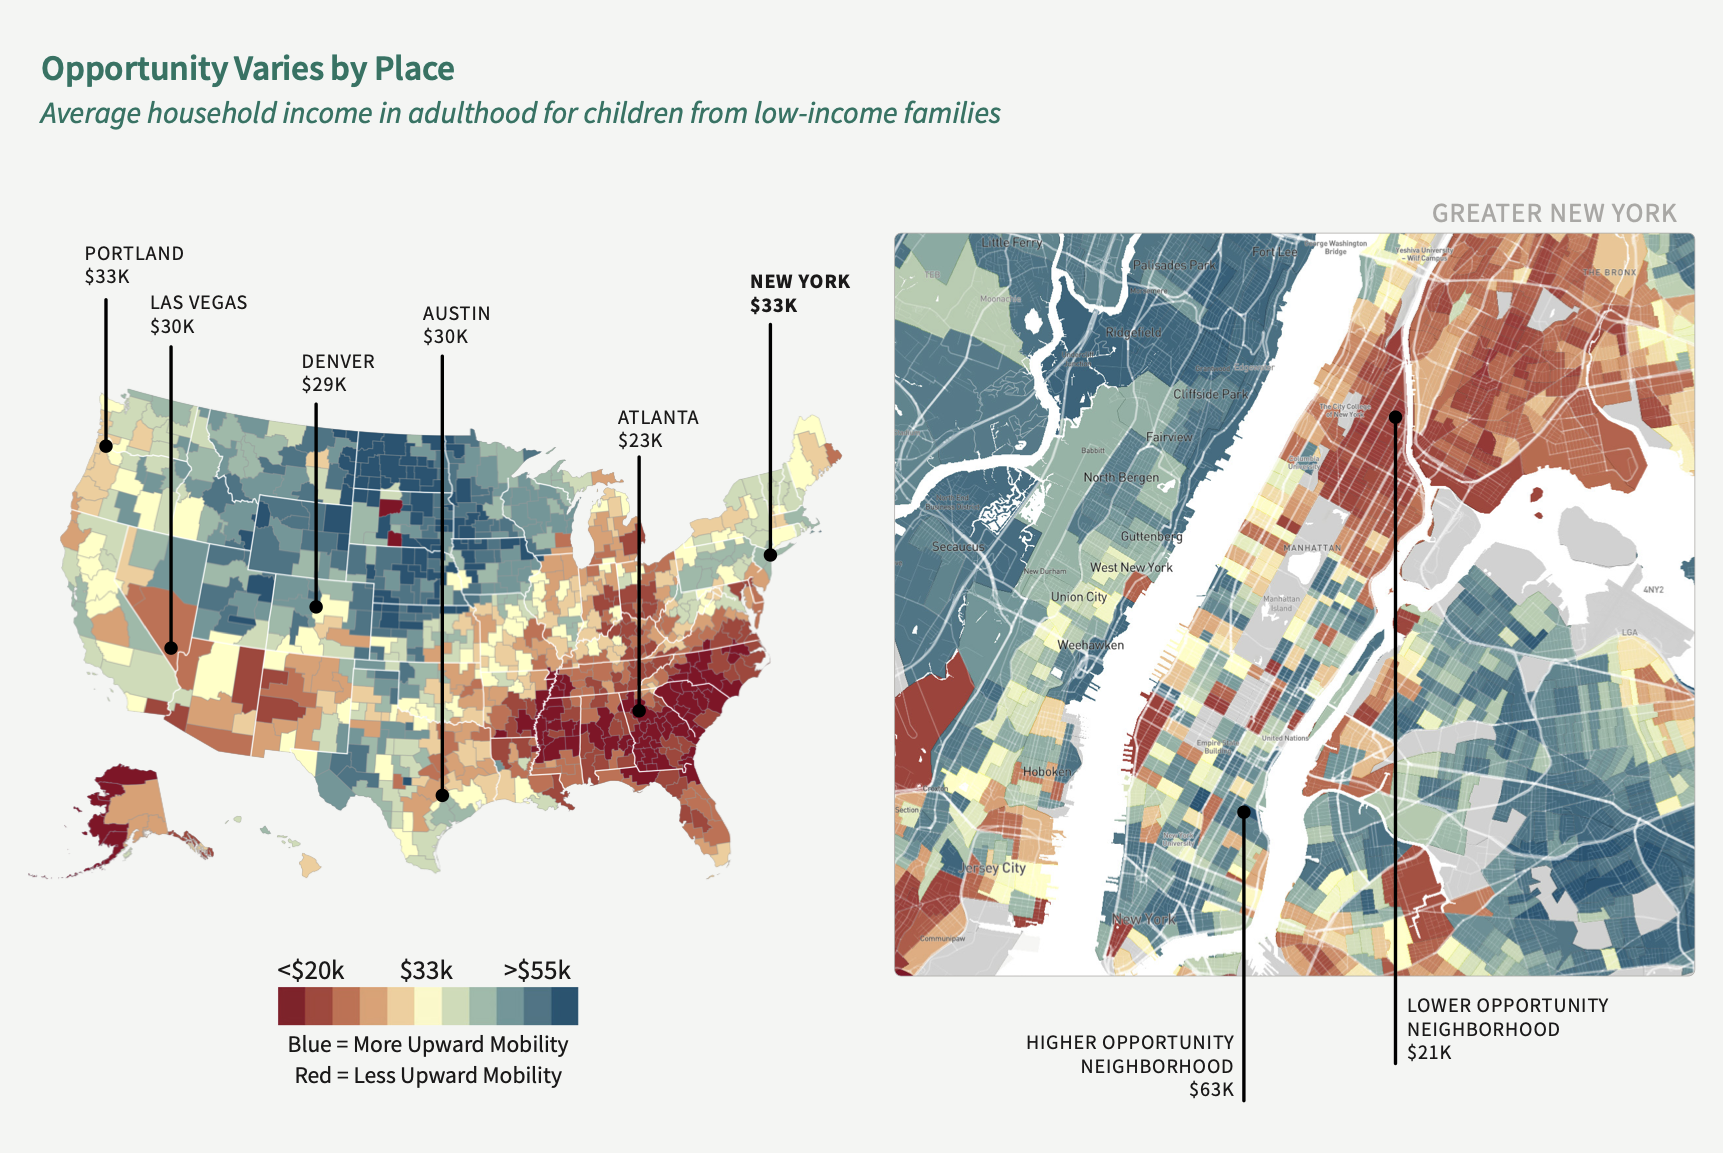
The Opportunity Atlas maps economic mobility across the United States by showing estimates of children’s future outcomes based on where they grew up. This source is useful for understanding how neighborhood conditions shape long-term opportunity.
What this tool shows:
Children’s estimated adult income outcomes.
Neighborhood-level economic mobility patterns.
Differences by parental income, race, and gender.
Neighborhood characteristics connected to mobility.
Metro-level mobility rankings and trends.
What’s in this dataset/tool:
Neighborhood mobility outcomes.
Adult household income estimates.
Race and gender filters.
Parental income comparisons.
Neighborhood characteristics.
Metro rankings.
Trend analysis tools.
Instructions: Open tool> type a neighborhood address in the search bar > review “Children’s outcomes in adulthood” and “Neighborhood characteristics” on the left side > hover over the location dot to see estimated household income in adulthood > compare surrounding areas using the heat map > select “Metro Rankings” or “Trend Analysis” for more data.
Equality of Opportunity Project — Geography of Upward Mobility in America
The Equality of Opportunity Project provides research and data on how children’s economic outcomes are shaped by the neighborhoods where they grow up. This source can help explain why place matters for upward mobility.
What this source shows:
How childhood environment affects adult outcomes.
How economic mobility differs across regions and neighborhoods.
How parental income connects to children’s future income.
How geography shapes opportunity.
What’s in this source:
Research findings on upward mobility.
Maps and data on children’s income outcomes.
Explanations of geographic differences in opportunity.
Links to related research and datasets.
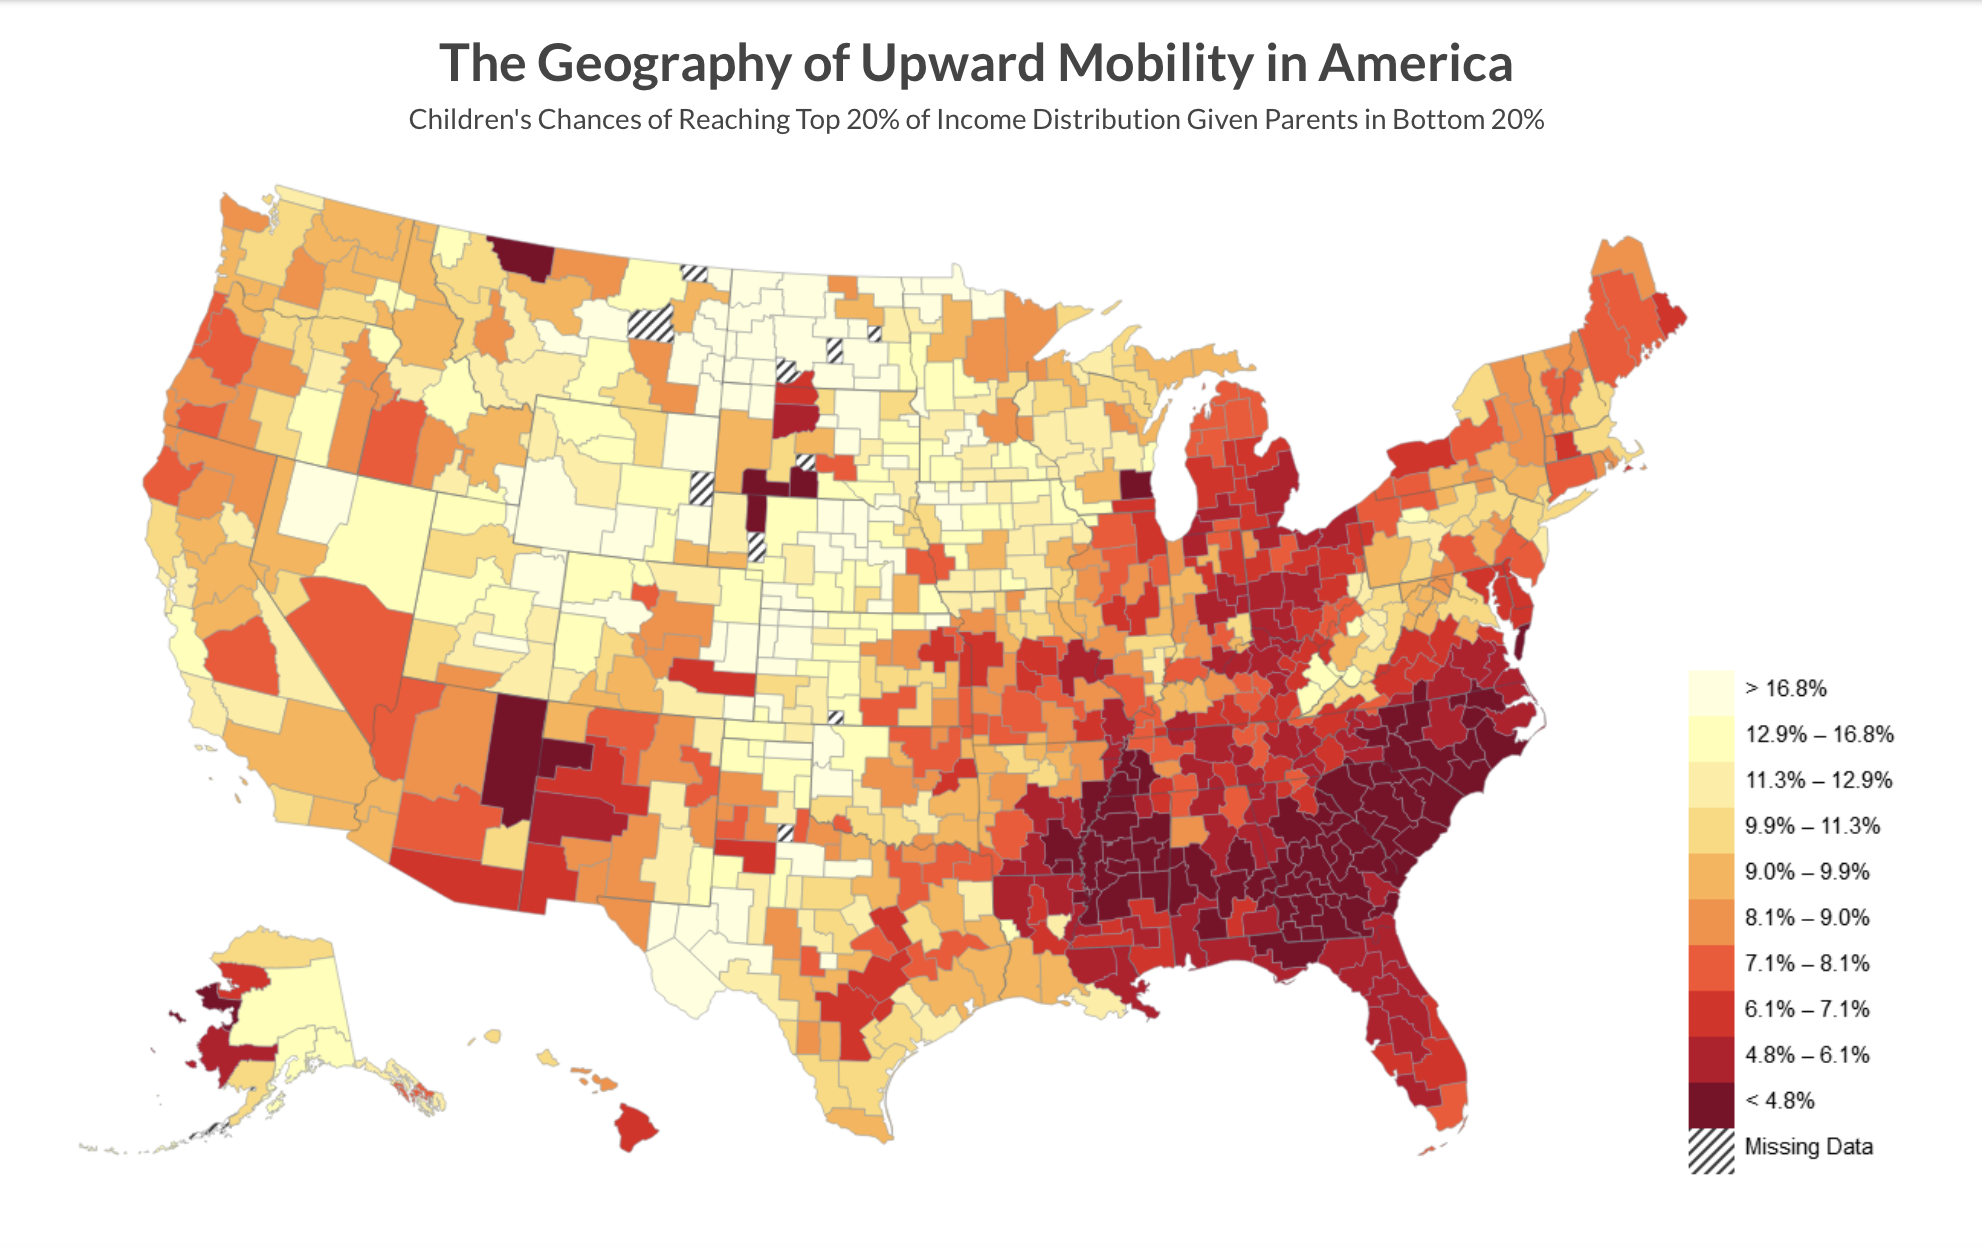
Instructions: Open the project page > review the map, graphs, and table depicting various findings on upward mobility > compare regional and neighborhood-level outcomes > use the findings to explain how place-based conditions can support or restrict economic advancement.
Travel & Transportation Access
Open Doors — U.S. Study Abroad Data
What this source shows:
Study abroad destinations.
Number of U.S. students studying abroad.
Regional and country-level participation patterns.
Trends in international educational experiences.
What’s in this dataset/tool:
Interactive study abroad destination data.
Country and continent-level data.
Participation totals.
Study abroad trends.
Institutional and national education data.
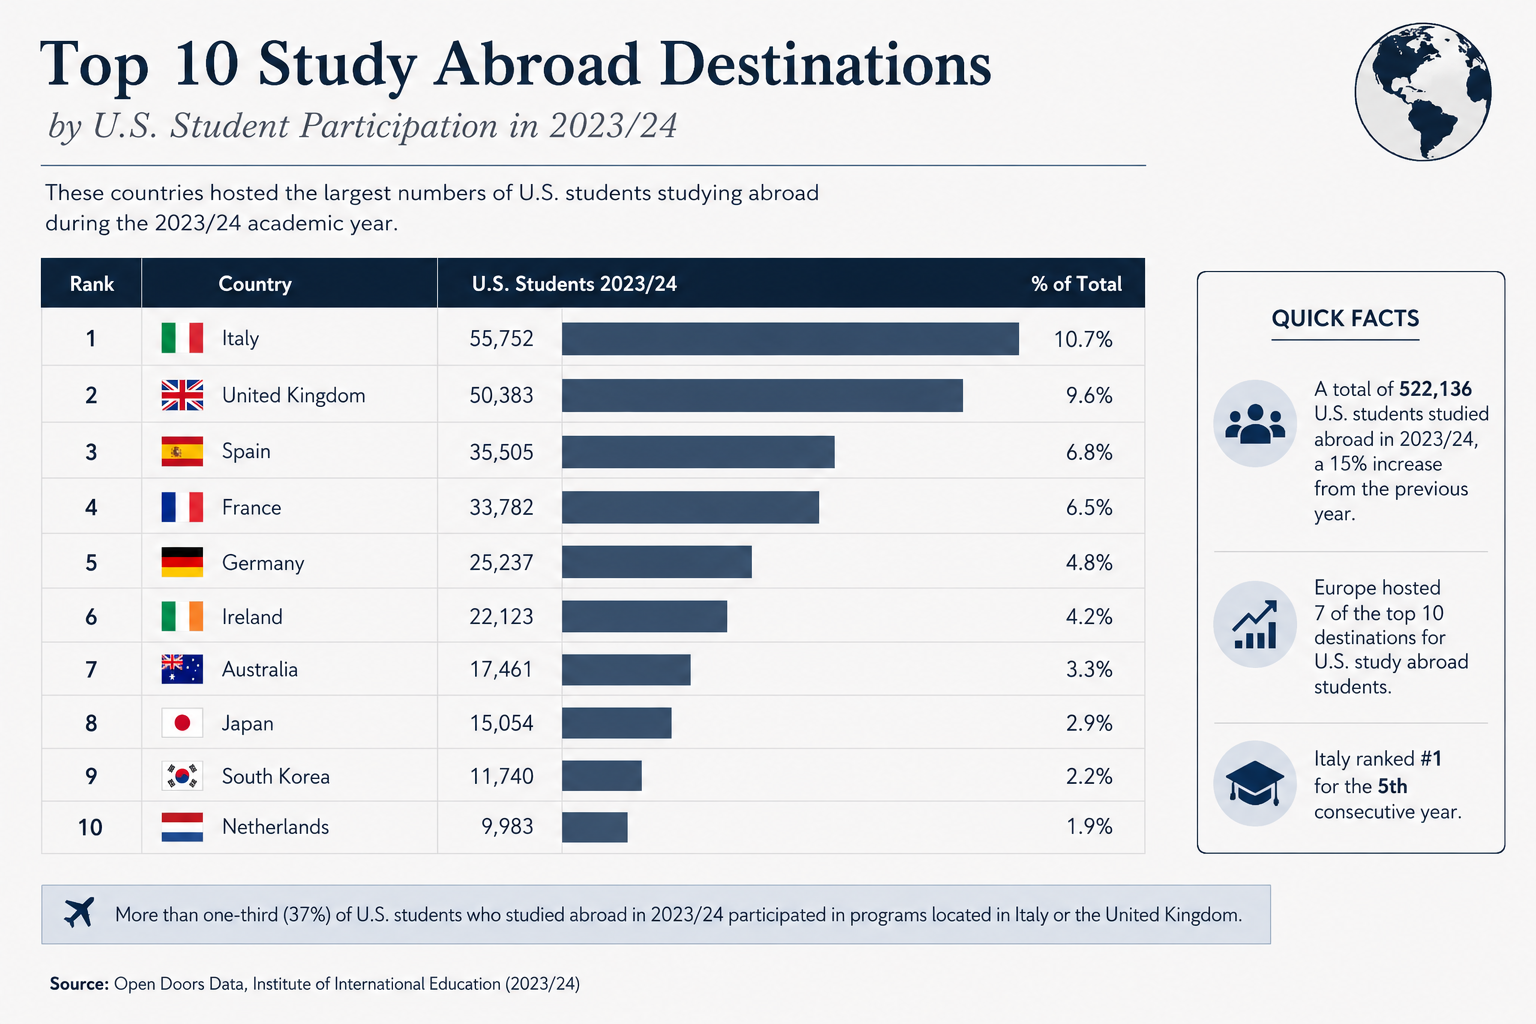
Instructions: Open the Open Doors study abroad data page> select the desired year or destination > review participation totals by country or region > use the data to discuss access to international education and cultural exposure.
Bureau of Transportation Statistics — Rural Access to Intercity Transportation
What this tool shows:
Access to intercity transportation in rural areas.
Rural transportation gaps.
County-level transportation access over time.
Transportation access differences by age, employment, and income.
What’s in this dataset/tool:
State-level maps.
County-level interactive transportation data.
Data for 2006, 2012, 2018, and 2021.
Transportation mode filters.
Percent with access.
Change in number of transportation facilities.
Demographic tables.
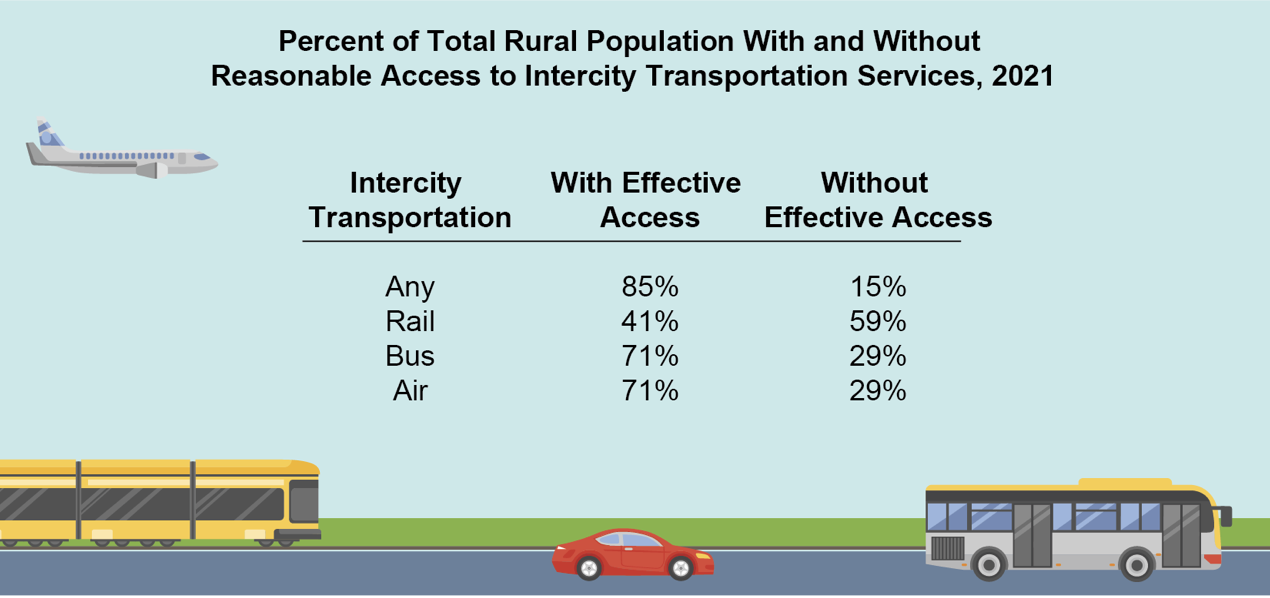
The Bureau of Transportation Statistics provides data on rural access to intercity transportation. This source is useful because transportation can determine whether residents can reach jobs, schools, health care, cultural activities, recreation, and travel opportunities.
Instructions: Open tool> choose whether to view “percent with access” or “change in number of facilities” > use the year slider to select a year > select travel type under intercity mode > filter county data > click a specific county on the map to see transportation access details.
Recreation, Parks & Leisure Access
County Health Rankings — Access to Exercise Opportunities
What this tool shows:
Access to parks and recreation facilities.
County-level exercise opportunity rates.
State and national comparison data.
Connections between recreation access and health.
What’s in this dataset/tool:
Percentage of residents with access to exercise opportunities.
County-level comparison data.
State-level data.
Health and community condition indicators.
Downloadable data.
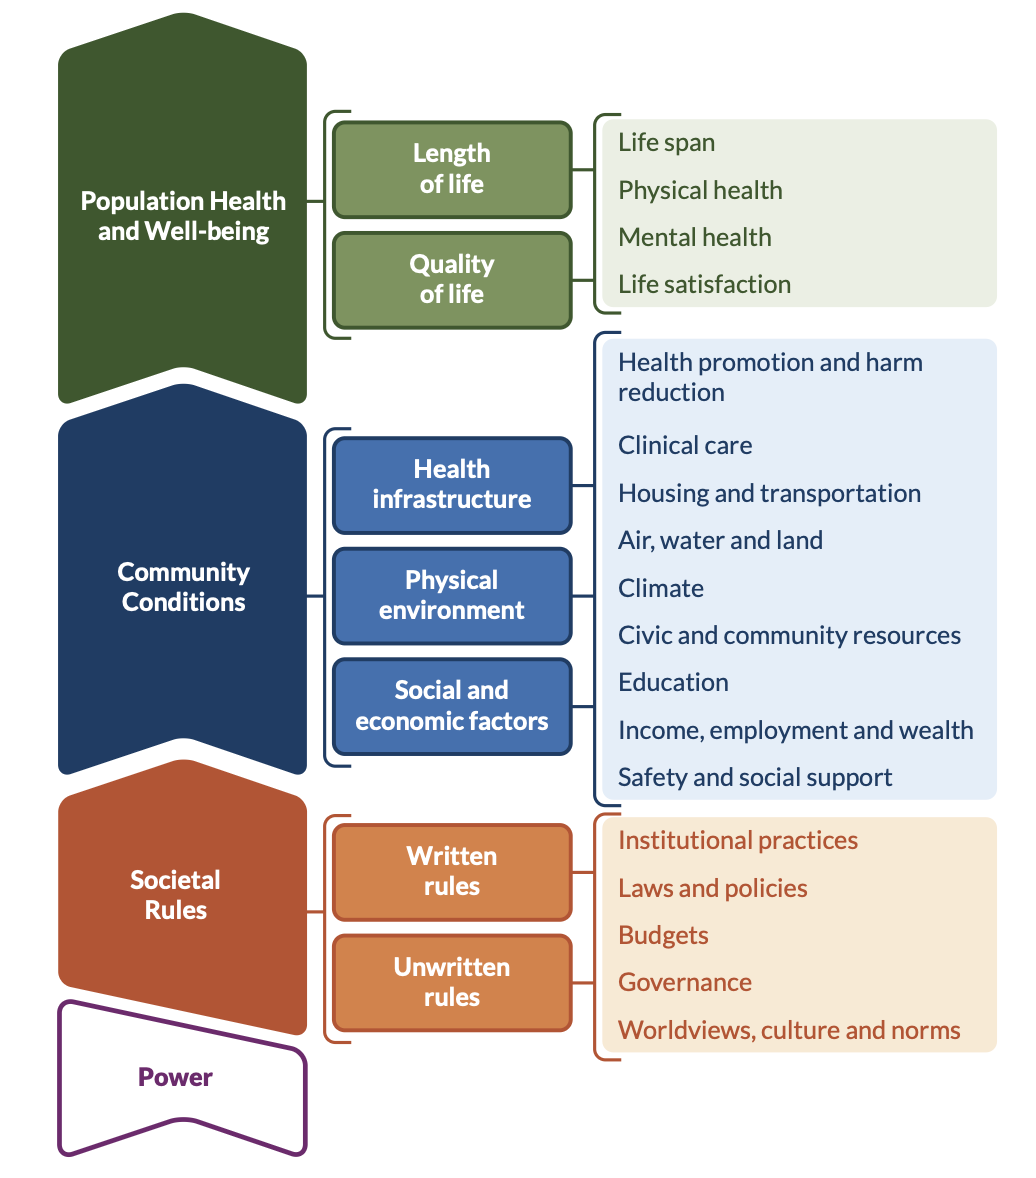
County Health Rankings’ Access to Exercise Opportunities measure shows the percentage of people in a county who live reasonably close to a park or recreational facility. This source helps measure whether residents have access to spaces that support leisure, recreation, health, and community connection.
Instructions: Open the measure page > search by county, state, or zip code and by year > review the Access to Exercise Opportunities percentage > compare the county rate to state and national averages > use the result to discuss whether residents have access to parks, recreation facilities, and leisure spaces.
Trust for Public Land — ParkScore / City Park Facts
What this tool shows:
Park access.
Park acreage.
Park investment.
Park amenities.
Park equity.
City park system rankings.
What’s in this dataset/tool:
ParkScore rankings for large U.S. cities.
City park facts.
Equity comparisons.
Amenity data.
Access and acreage data.
Visual comparison tables.
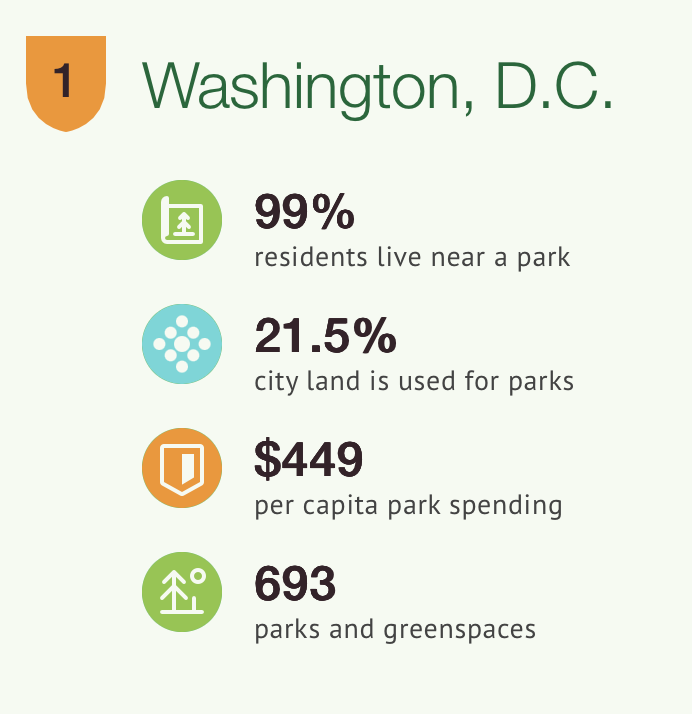
Trust for Public Land’s ParkScore and City Park Facts tools show how cities compare in park access, acreage, investment, amenities, and equity. These are useful for evaluating access to leisure and life-enrichment opportunities because parks support exercise, recreation, gathering, youth programming, and cultural events.
Instructions: Open ParkScore> select the desired city and state > review the city’s overall ranking and score > compare acreage, access, investment, amenities, and equity > use the rankings page to compare cities across the United States.
Project Play — Youth Sports Participation Trends
What this source shows:
Youth sports participation trends.
Differences by gender, income, and race.
State-level sports participation data.
Changes in participation before and after COVID-19.
What’s in this source:
Bar graphs for sport participation among children ages 6–17.
Data by gender, income, and race.
Interactive state map.
Participation data for 2020 and 2021.
State of Play reports.
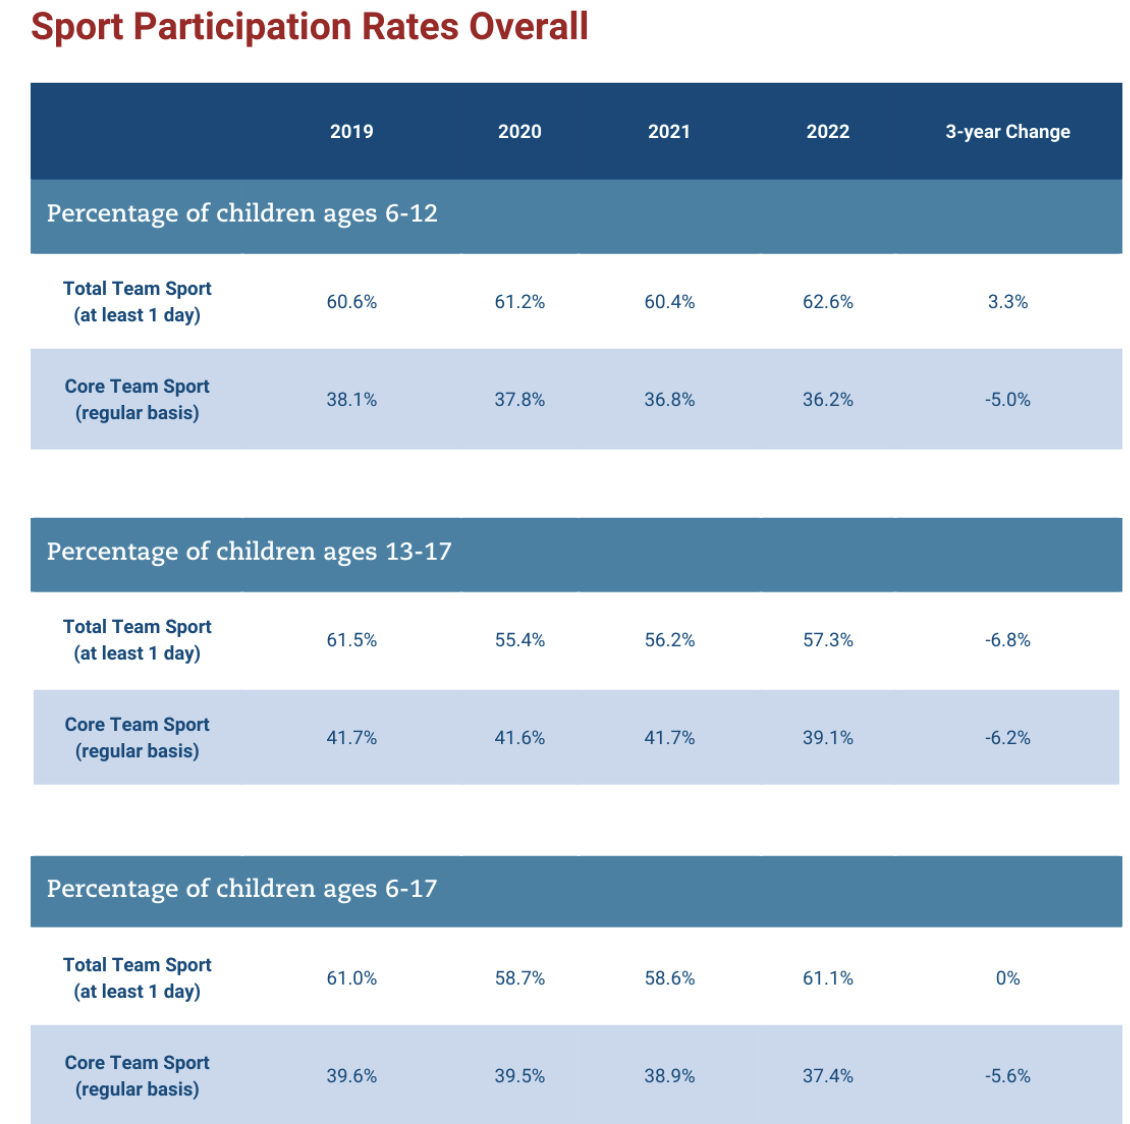
Project Play provides data on youth sports participation by gender, income, race, and state. This source is useful because sports can support recreation, social connection, physical health, youth development, and life-enrichment.
Instructions: Open article> scroll to the color-coded map under “Overall Sports Participation by State” > hover over the state of interest for the exact percentage > use the color key for visual comparison > review participation graphs by gender, income, and race.