
Community Stewardship & Placemaking
People have a right to community stewardship and placemaking opportunities allowing them to positively contribute to and care for their local communities and ecosystems. These efforts can include environmental restoration, volunteerism, beautification projects, public space improvements, and community-led initiatives. Below you can find data sources to determine your access levels in terms of where these opportunities exist and how residents can get involved.
National Data Sources

Data & Mapping Resources
Community stewardship and placemaking opportunities are supported by a wide range of civic organizations, volunteer programs, parks, and community assets throughout the United States. According to the AmeriCorps Civic Engagement and Volunteering Supplement, approximately 75.7 million Americans (28.3% of adults) formally volunteered through an organization between 2022 and 2023, contributing billions of hours toward strengthening communities and supporting local initiatives.
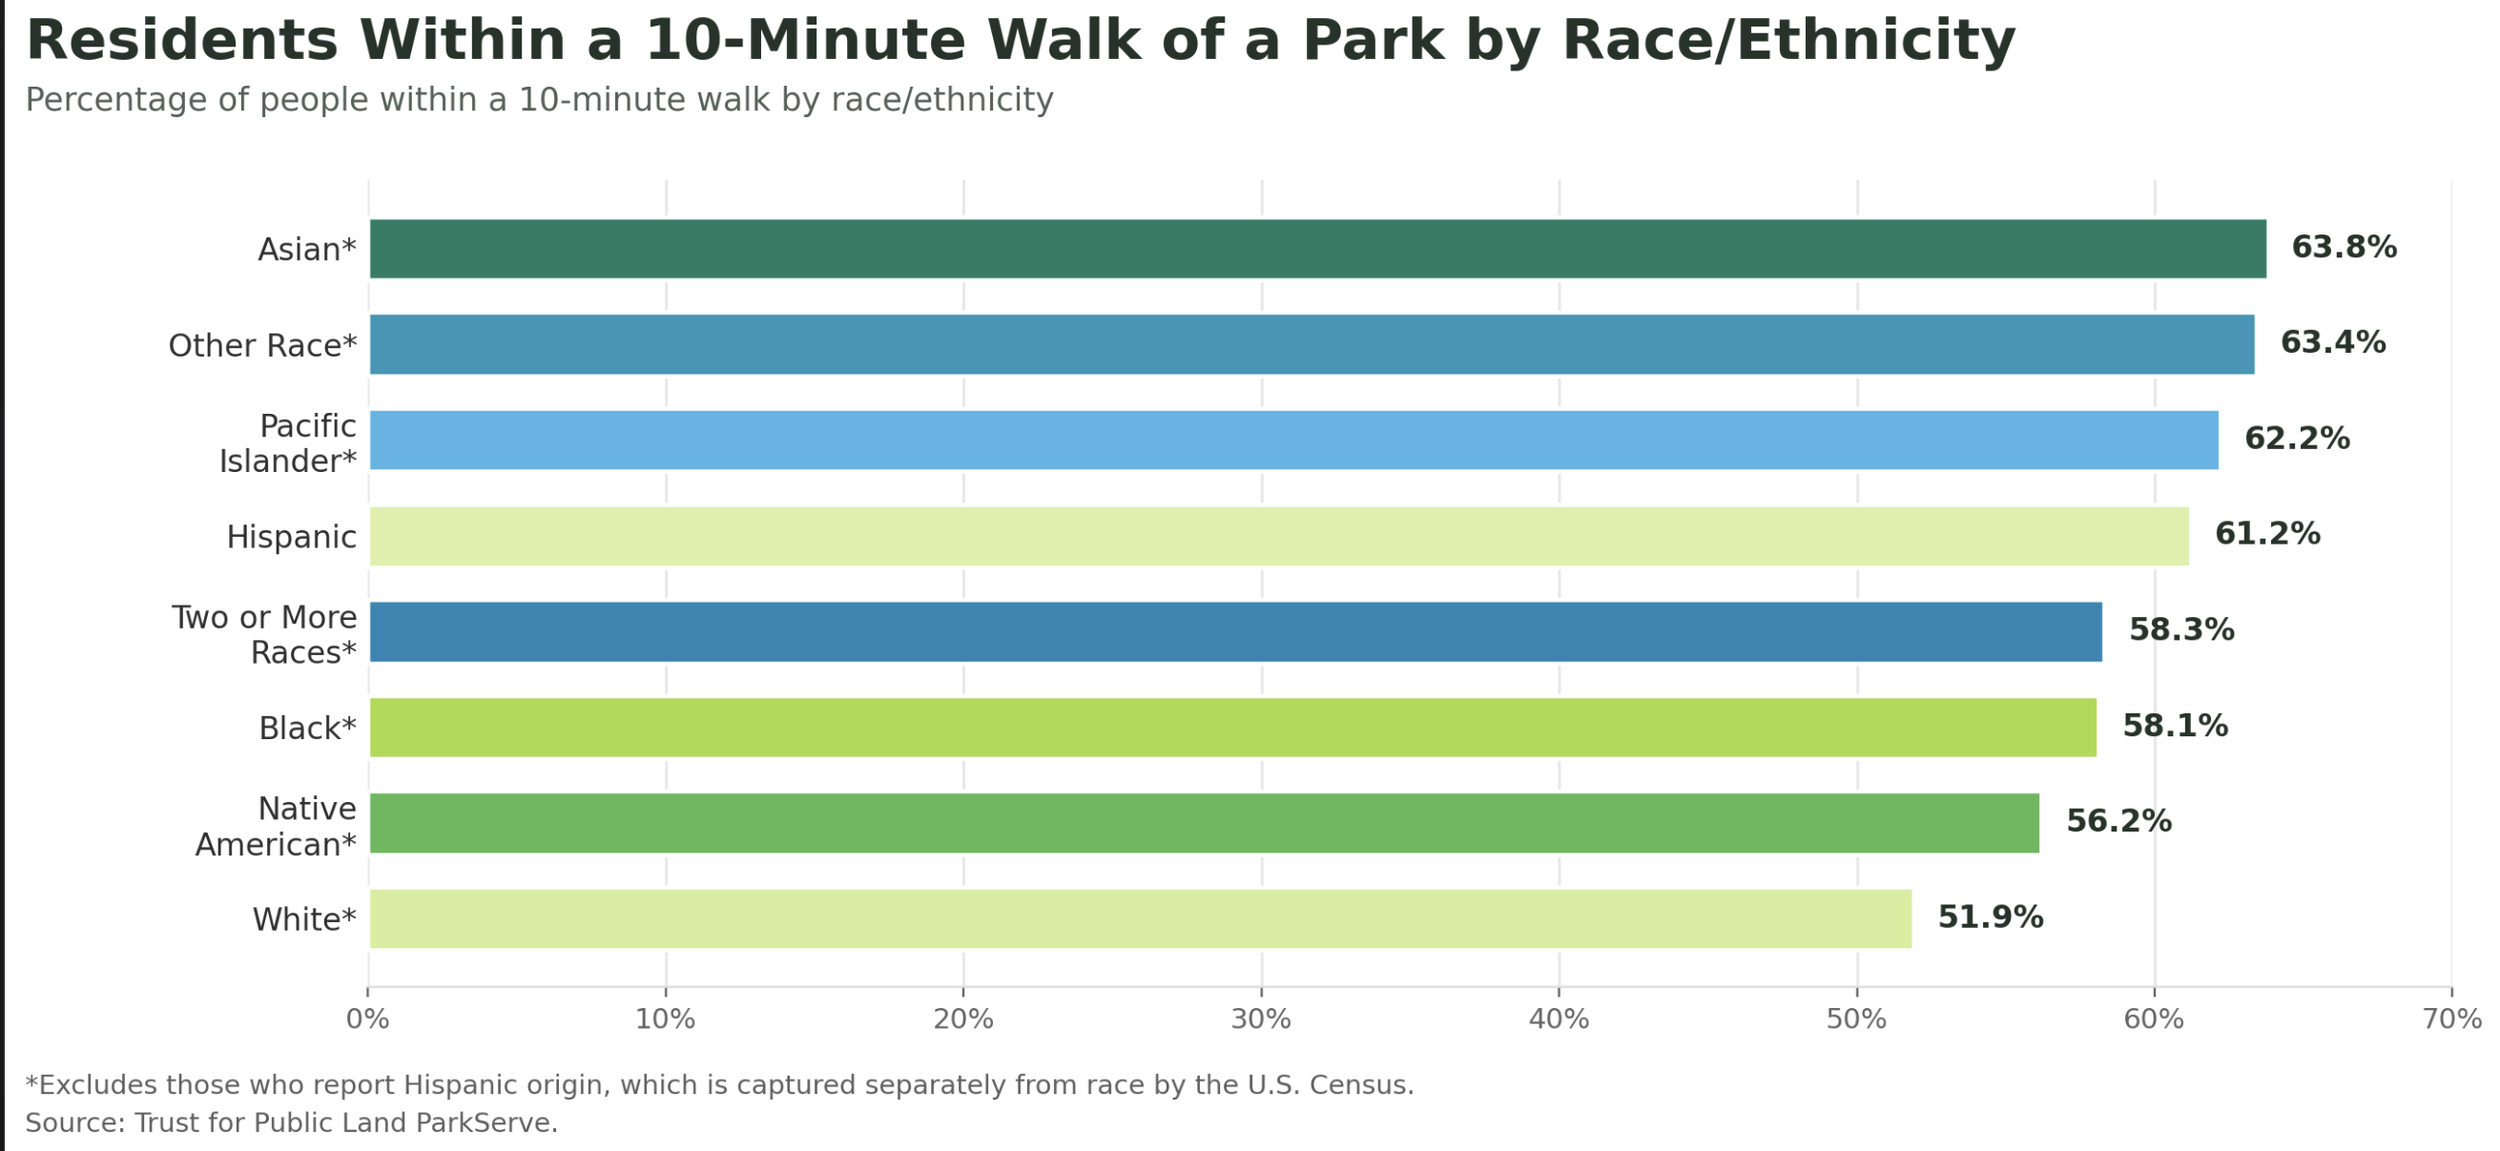
Access to public spaces remains an important component of community stewardship and placemaking. According to the Trust for Public Land, more than 100 million Americans, including 28 million children, do not have access to a park within a 10-minute walk of home, highlighting ongoing disparities in access to community spaces that often serve as hubs for recreation, volunteerism, environmental stewardship, and civic engagement.
The following national data sources provide maps, datasets, and planning tools that help communities identify stewardship assets, evaluate access to placemaking opportunities, and support community-led environmental and civic improvement efforts.
National Snapshot
Over 100 million Americans lack access to a park within a 10-minute walk of home.
Nearly 28 million children do not live near a walkable park.
Local agencies manage more than 11 million acres of parkland nationwide.
Over 10,000 park and recreation agencies serve communities across the United States.
The National Park System includes more than 420 sites nationwide.
The United States contains approximately 130 million acres of urban and community forests.
Trust for Public Land - ParkServe / ParkScore
The Trust for Public Land’s ParkServe and ParkScore tools help communities understand who has access to parks, where park access gaps exist, and how cities compare in providing public green space. Together, these resources show park access, equity, acreage, amenities, investment, and priority areas for future park or placemaking projects. They are useful for identifying:
Where residents may have limited access to public spaces that support recreation, environmental stewardship, community gathering, and neighborhood improvement.
Where residents do and do not have access to a park within a 10-minute walk.
How park access differs by race, ethnicity, age, income, and neighborhood.
Which communities may need more park investment, green space, or public-space improvements.
What’s in this dataset/tool:
10-minute walk park access data
Park equity indicators
Race, ethnicity, age, and income data
Park acreage and amenity data
ParkScore city rankings
Priority investment areas
Downloadable maps and reports
-
The main ParkServe website explains Trust for Public Land’s national park access work and provides background on why parks within a 10-minute walk matter for health, equity, climate resilience, and community connection. This page is useful for understanding the purpose of the ParkServe tool before using the map or downloading data.
-
The ParkServe Map allows users to search for a city, town, or county and view local park access data. It shows which residents live within a 10-minute walk of a park, where access gaps exist, and which areas may be priorities for new parks, trails, or public-space investments.
-
ParkScore ranks the park systems of the 100 most populous U.S. cities using access, equity, acreage, amenities, and investment. It is useful for comparing cities and understanding how well large urban park systems are serving residents
Instructions: Open the main website to learn about ParkServe and national park access data > open the ParkServe Map to search for a city, town, or county > review the community profile and 10-minute walk map > explore access, equity, and priority-area data > open ParkScore to compare large-city park systems by access, equity, acreage, amenities, and investment > use the maps, rankings, and reports to identify where parks, green space, and placemaking investments may be needed.
USDA Forest Service - National Stewardship Mapping Project
What this tool shows:
Stewardship organization locations
Civic and nonprofit networks
Community care and improvement efforts
What’s in this dataset/tool:
129,000+ nonprofit office locations
Organization names
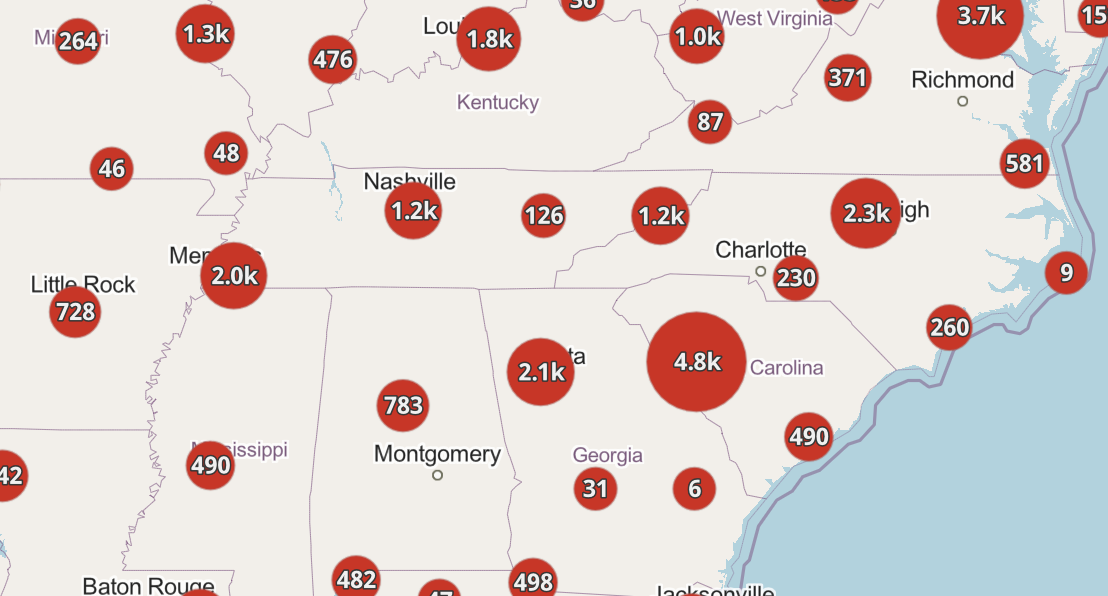
The STEW-MAP National Map is an interactive Forest Service tool that maps nonprofit organizations involved in community stewardship across the United States and its territories. The map combines IRS 990 nonprofit data with STEW-MAP survey data to show where civic stewardship organizations are located and how they support local communities
Instructions:Open site> open the “Explore” page > use the search bar or zoom tools to move to a city, state, or region > click on map points to view organization names, focus areas, addresses, and websites > use the map to identify stewardship organizations, potential partners, and areas where community stewardship networks are more or less visible.
What this tool shows:
Volunteer opportunities by location.
Stewardship projects on public lands.
Conservation, restoration, and park-based activities.
What’s in this dataset/tool:
Federal volunteer listings
Park and trail stewardship projects
Conservation and restoration opportunities
Cleanup and maintenance activities
Agency, state, and distance filters
Event details, dates, and requirements
Application or contact links
Volunteer.gov is a national portal for finding federal volunteer opportunities by place, agency, activity type, and distance. For a stewardship and placemaking page, it helps users identify where hands-on opportunities exist for conservation, restoration, trail work, park support, cleanup events, and public-land stewardship.
Instructions: Open site> click “Search Volunteer Opportunities” > enter a state, location, agency, distance, or category such as “Conservation” > browse available listings > click a listing to review details, dates, requirements, and location > select “Apply Now” or use the contact information provided by the host agency.
COMMUNITY IDENTITY DAta
NATIONAL NEIGHBORHOOD INDICATORS PARTNERSHIP
What is in the source:
Neighborhood-level data resources
Housing, health, education, and safety data
Neighborhood change research
Community engagement case studies
The National Neighborhood Indicators Partnership helps communities use neighborhood-level data to understand local conditions, identify problems, promote equity, and support resident participation in planning and decision-making.
Instructions: Open the website > Review publications, projects, and partner examples > Find a community using local data to address a problem > Apply similar indicators to your own community.

COUNTY HEALTH RANKINGS
What is in the dataset:
County association rates
State and national comparisons
Civic and social organizations
Religious and business groups
Labor and professional associations
Sports and recreation organizations
Downloadable county data
This measure shows the number of membership associations per 10,000 residents in a county. It helps estimate whether residents have formal opportunities to meet, volunteer, organize, build relationships, and participate in community activities.
Instructions: Open Source > Search for your county > Review its association rate > Compare it with state and national averages > Use the results to discuss access to organized community life and social connection.
NATIONAL CIVIC LEAGUE CIVIC INDEX
What is in the source:
Civic engagement assessment questions
Community trust and collaboration measures
Resident participation indicators
Leadership and shared decision-making questions
Equity and inclusion guidance
Community problem-solving frameworks
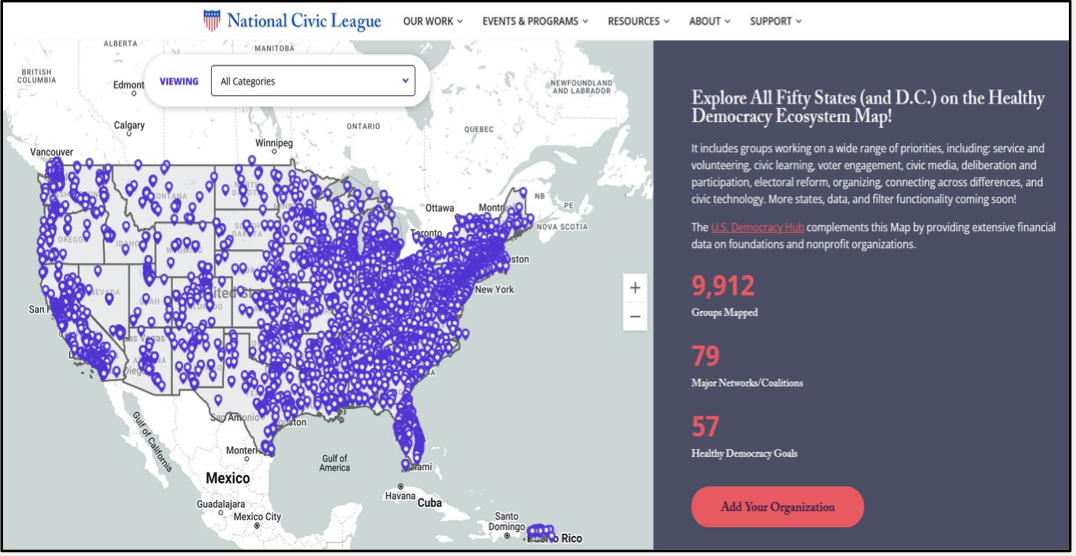
The Civic Index helps communities measure civic capital, including trust, leadership, resident participation, collaboration, inclusion, and the ability to solve problems together. It is useful for evaluating whether residents have a shared purpose and meaningful opportunities to influence community decisions.
Instructions: Open the Civic Index page > enter your info, including name, email, and zip code, to download the index > Review the civic capital categories > Use the questions as a checklist > Evaluate whether residents have access to meetings, leadership roles, shared decisions, and community partnerships.
COMMUNITY VULNERABILITY DATA
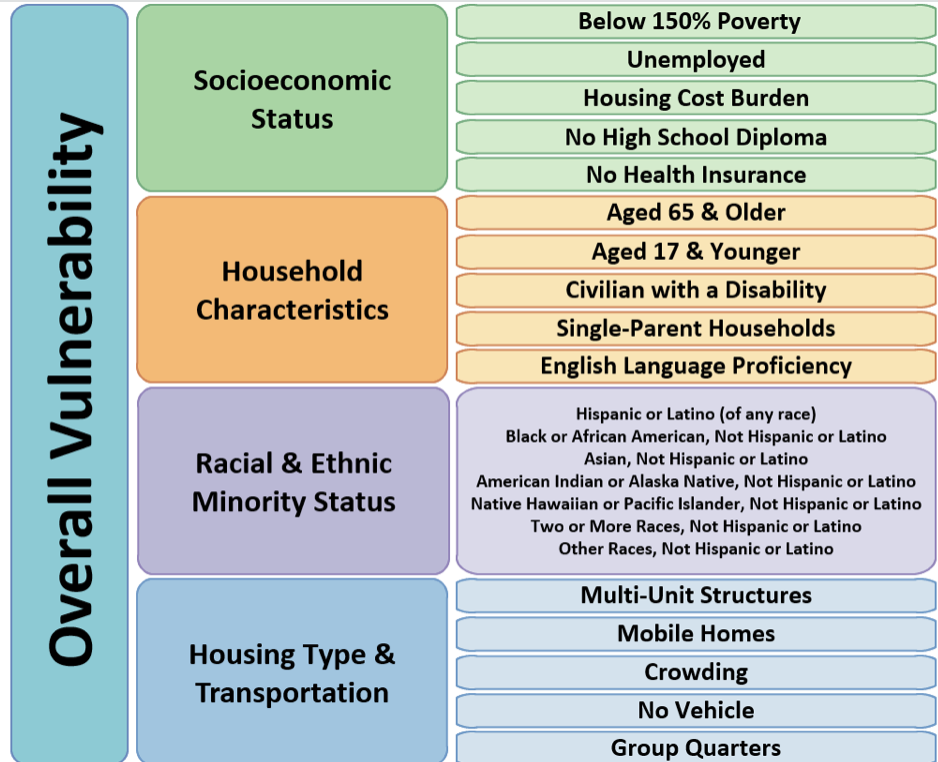
CDC/ATSDR SOCIAL VULNERABILITY INDEX
What is in the dataset:
Overall vulnerability rankings
Census-tract and county data
Poverty and employment indicators
Age and disability data
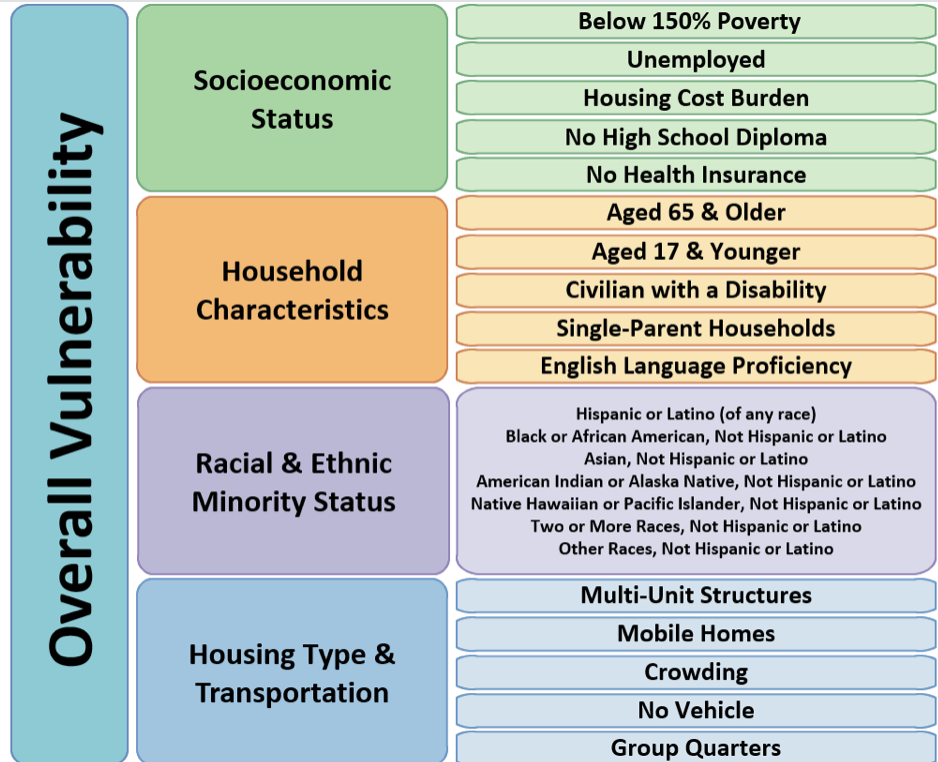
The Social Vulnerability Index identifies communities that may need additional support during disasters, public health emergencies, or other disruptions. It highlights areas where poverty, disability, transportation barriers, housing conditions, and other factors may limit community resilience.
Instructions: Open the SVI map or data page > Select a state or county > Identify high-vulnerability areas > Compare them with parks, libraries, schools, clinics, recreation centers, and transit.
COMMUNITY INSTITUTIONS Data
NATIONAL RECREATION AND PARK ASSOCIATION RESEARCH
What is in the source:
Parks and public health research
Recreation-center studies
Equity and access reports
Youth, senior, and family programming
NRPA provides research showing how parks and recreation centers support health, community connection, youth and senior programs, climate resilience, and emergency response. These spaces often function as important gathering places and community-support hubs.
Instructions: Open the research page→ Search for parks, recreation centers, equity, health, or resilience → Select relevant reports → Compare the findings with local facility locations and access.
PUBLIC LIBRARY ASSOCIATION DATA SOURCES
What is in the source:
National library datasets
PLA survey data
Library benchmarking tools
Community-planning resources
Historical library data
Peer-community comparisons
Data visualizations
The Public Library Association provides access to national library datasets, surveys, benchmarking tools, and community data resources. These tools help compare library services and evaluate whether residents have access to meeting spaces, technology, educational programs, and public resources.
Instructions:Open the PLA data page> Select a dataset or benchmarking tool > Search for a library system or community > Compare programs, visits, services, and access with similar communities.
INSTITUTE OF MUSEUM AND LIBRARY SERVICES PUBLIC LIBRARIES SURVEY
What is in the dataset:
Library visits
Public service hours
Programs and attendance
Staffing levels
Internet and electronic services
Operating revenue and expenses
Library branches and service outlets
The Public Libraries Survey provides national data on library visits, programs, staffing, hours, funding, internet services, and library locations. It helps show whether libraries are active and accessible community institutions.
Instructions:Open the survey page > Download the data or tables > Search by state, county, or library system > Review visits, hours, programs, staffing, and locations.
EPA region 4 Data Sources
Georgia Adopt-A-Stream
What this tool shows:
monitoring locations.
Water-quality data by site.
Local watershed stewardship activity.
What’s in this dataset/tool:
Water-quality monitoring stations
Stream, lake, wetland, and coastal data
County and watershed search tools
Monitoring group information
Training and certification resources
Data portal for submitted results
Tools for starting a monitoring group
Georgia Adopt-A-Stream connects stewardship with community science. Residents can monitor waterways, submit results, search existing monitoring stations, and use collected data to better understand local environmental conditions.
Instructions: Open tool click desired county, watershed, or monitoring site > review available station results such as pH, dissolved oxygen, temperature, conductivity, turbidity, and bacteria when available > use training resources to join or start a monitoring group.
South Carolina DNR — SCORE Oyster Recycling Map
SCORE is useful because it connects residents to place-based coastal stewardship and restoration data. Users can identify shell recycling locations, restoration projects, and volunteer opportunities tied to oyster reef health and habitat improvement.
Instructions for Oyster Shell Recycling Drop-off Map: Open site > Scroll down under “Shellfish Mapping Applications” and Select “SCORE Oyster Recycling Locations” > use the search bar to enter an address, city, or county > zoom to nearby recycling locations > click a shell symbol to view site details > review location information and recycling details.
What this tool shows:
Oyster shell recycling drop-off locations.
Coastal restoration activity.
Stewardship sites in South Carolina.
What’s in this dataset/tool:
Oyster shell recycling map
ArcGIS site locations
Recycling site details
Restoration project information
Volunteer event calendar
Volunteer forms
Coastal habitat resources
Monitoring and restoration support