
lack of access to employment
People have a right to certain protections of employment & access to legitimate financial services & institutions. Below you can find data sources to determine exposure, vulnerability, and related resources.
Unemployment critically affects societies worldwide, impacting both individuals and whole economies. The Bureau of Labor Statistics defines unemployment as (1) not having a job and (2) in the last 4 weeks, having:
*Contacted:
-An employer directly or had a job interview
-A public or private employment agency
-Friends or relatives who could provide employment
-A school or university employment center
*Submitted resumes or completed job applications
*Placed or responded to job advertisements
*Checked union or professional registers
*Conducted some other means of active job search
It is important to note that there are large and persistent differences in unemployment rates across local labor markets, so it is key to consider local data, as well as national. We must also recognize that the unemployment rate does not include all citizens, only those who are actively seeking employment (as shown above).

PREVALENCE OF UNEMPLOYMENT
Unemployment may be more prevalent in some areas than others due to economic fluctuations, social and demographic factors, policies and regulation, as well as more global scale factors, such as technological advancements, globalization, lack of access to education and training, and underlying systemic discrimination or bias. Unemployment is typically most prevalent in cities and surrounding areas with economic downturns, states facing industry challenges, and rural areas with limited industries for employment. Understanding data about unemployment gives insight to the economic health of an area, labor markets, and policy insights.
To determine prevalence of unemployment in an area, view the following resources:
National Data
The US Bureau of Labor created a statistics table analyzing unemployment by age, sex, race, ethnicity. This resource provides labor force statistics from the Current Population Survey, focusing on quarterly averages of unemployment rates.
US Bureau of Labor instructions: Open tool > to navigate this data, start in the left-most column > Locate the gender and age group that you want to focus on > In the corresponding row to that gender/age group, you can view the changes in unemployment rates across race and time.
metropolitan area data
For a better understanding of burdens surrounding workforce development, see CEJST Tool developed by The Council of Environmental Quality. This tool provides information about each US county, including a breakdown by population and demographics. The tool determines whether a certain neighborhood is considered disadvantaged, and what burden thresholds it may meet. For the area selected by the user, the tool provides data on climate change, energy, health, housing, legacy pollution, transportation, water and wastewater, and workforce development. Specifically regarding workforce development, this tool can be used to compare linguistic isolation, median income, poverty rate, unemployment, and education between multiple U.S. counties or neighborhoods.
CEJST Instructions: open tool > scroll down and click on go to resource> insert your zip code or city > the map will zoom into the corresponding part of the map, click around to find your neighborhood > click on the desired neighborhood > in the column to the right of the map, scroll down to workforce development > click the drop down > view neighborhood specific data
The US Bureau of Labor Statistics has collected and compiled data on unemployment rates across metropolitan areas as of 2025. This interactive map can be used to analyze unemployment trends based on location, which can give insight to demographic breakdowns of populations, types of employment offered or in demand, and local policy in place for the selected area.
This tool can be used to analyze:
Metropolitan area unemployment rates
Changes in unemployment throughout a year
Lowest and highest unemployment rates in the US
Large changes in metropolitan area employment
And more

Metropolitan Unemployment Rates Map Instructions: Open tool > view legend below map, displaying unemployment rates (in % form), separated by color > hover over the colored dots in the legend to view all cities within the category > hover over the colored dots on the map to display city-specific data > click Show Table at the bottom of the page to view data in table format > to view more charts, click the box titled Metropolitan area unemployment rates > select the desired topic from the dropdown menu > click Go
county & local data
USDA county level data sets provide data for each U.S. state and county on poverty, population, unemployment, education, and documentation. Within the unemployment section, data is provided on the unemployment rate (in %) and median household income from 2015-2023.
USDA county level data sets instructions: Open tool > under in this section select unemployment > in the dropdown for state, select your state > click submit > locate your county on the chart > collect and analyze data
To analyze this data:
-View the data for your state and county.
-Compare data between counties in your state or between multiple states:
-Are there differences in unemployment rates or household income?
-If so, what may be causing differences? Demographic differences? Education? Location? Local policy?
-Is unemployment more prevalent in some areas than others?

Employment Uncertainty
Employment uncertainty means not knowing the state/security of your current job, often leading to stress. This feeling is not about concrete job loss now, but the constant anticipation of possible shifts. It is important to work towards employment certainty because as humans, we succeed from stability, predictability, and sense of control in our lives.
Factors affected by employment uncertainty may include:
Financial stability
Mental well-being
Personal Identity
How is employment uncertainty measured?
According to Employment Standards Database, job uncertainty can be measured by:
-
Permanent Employment:
Open-ended, ongoing employment relationship
Employees tend to benefit from predictable working conditions, regular hours and wages, and often have access to employer-provided benefits and entitlements.
Sustained by a contract of employment between each employee and employer, which establishes work rules and benefits systems.
NOT necessarily categorized by a high degree of security - permanent employees may lack control over the labor processes and earn low wages.
In the US, the Fair Labor Standards Act (FSLA) entails no statutory protections against dismissal, or in legal terms, “as-will employment”.
Increasing job uncertainty can be measured through one of its effects - decreasing job tenure (jobs held for shorter lengths of time)
Temporary Employment:
Tends to be more precarious than permanent forms of employment.
Uncertain by definition.
Temporary or Contract employment affords employers the ability to reduce their labor costs by eliminating workers without the need to provide justification for termination, or provide severance pay.
Temporary employees are also excluded from certain workplace benefits.
Can be divided into 4 categories:
(1) Agency, (2)Fixed-term or contract, (3) Seasonal, (4) casual employment
-
Related to the degree of certainty continuing employment
Employees with short job tenure are more likely to experience uncertainty during the duration of employment
Job tenure can shape an employee's access to regulatory protections
Many jurisdictions have statutory benefits that require a certain minimum period of job tenure as a condition of eligibility
-
Termination notice:
Many jurisdictions require employers to provide a certain period of written notice before an employment relationship is terminated
This notice is intended to provide employees with a limited amount of advance warning to plan for termination
Termination pay:
Many jurisdictions require employers to provide termination pay when notice is not provided.
Typically in lieu of notice is equivalent to the pay period that would have been worked if proper notice was given.
Severance pay:
Provided to eligible employees whose employment is severed
Intended to compensate for the loss of long-term employment and the seniority that accompanies such employment
Distribution of employment uncertainty
How does the distribution of job uncertainty change across the US? States? Counties? What factors cause differences in these rates?
In 2025, the American Psychological Association conducted a study on job insecurity leading to stress among US workers. According to the survey:
More than half (54%) of US workers said that job insecurity had a significant impact on their stress levels at work.
More than a third of respondents (39%) said they are concerned they may lose their job in the next 12 months due to policy changes.
44% of workers said that if they lost their current job, they would need to move to a different field of work to find a new job, creating more stress.
It is evident that job insecurity is present in the United States. In order to understand and mitigate related inequalities, we must understand which groups are most at risk. Below, find steps to collect and analyze data to determine populations at risk.
Step 1: Determine if certain groups are more prone to experiencing unemployment or employment insecurity:
What we know: Major work group unemployment rates
-Adult men: 3.9%
-Adult women: 3.9%
-Teenagers: 15.7%
-White: 3.8%
-Black: 7.5%
-Asian: 3.6%
-Hispanic: 4.9%
From this data, we can conclude that Teenagers and Black are the most unemployed groups, both almost doubling the rates of their counterparts. This data indicates that Black neighborhoods and communities are more prone to experience unemployment and job uncertainty.
What we know: According to the US Bureau of Labor Statistics,
-The number of people employed part time for economic reasons increased by 980,000 in 2025.
-The number of people not in the labor force who are currently seeking a job increased by 684,000 in 2025 (who are not considered in the total unemployment rate due to actively seeking employment).
-The overall unemployment rate in the US increased from 4.0% to 4.5% in 2025.
From this data, we can conclude that desire for employment for various reasons is rising, while ability to get employed or stay employed is lowering.
Step 2: Determine areas where at-risk populations are most prevalent:
ArcGIS created a map utilizing 2020 census data to view areas on the U.S. map by race and ethnicity. Within the map, you can browse or search for a desired location, giving a visual breakdown of races present in that area including:
American Indian
Asian
Black or African American
Hispanic or Latino
Pacific Islander
White
Two or more represented races
Other
ArcGIS Instructions: open tool > in the lower right corner, click the search icon > insert desired address/area OR use current location > once zoomed in on the desired area, click on neighborhoods or blocks to view a breakdown of the demographic in a given area > collect and analyze data
What we know: Based on other unemployment data, we know what groups are more prone to unemployment or job insecurity. Using this map, we can find where those individuals/communities are most prevalent, and provide necessary information/resources to that community or area.
Economic stressors
According to Brown University, economic stress is defined as the feeling of stress due to the current state of one’s personal finances or fear about the economy, which can lead to harmful impacts, both physical and mental. This could include pressures or strains stemming from job loss, financial instability, limited resources, comparing financial resources with peers, negative economic conditions, such as debt or unemployment or extreme life events leading to major changes in income or budget.
APA surveys show that work, money, and economy are the top 3 sources of stress in the US. Economic stress becomes more complicated because of its multiple dimensions, contextual features, temporal features, and social or relational factors. Ultimately, economic stress can lead to the inability to meet current financial needs and loss of income and crucial financial resources.
Causes & Consequences
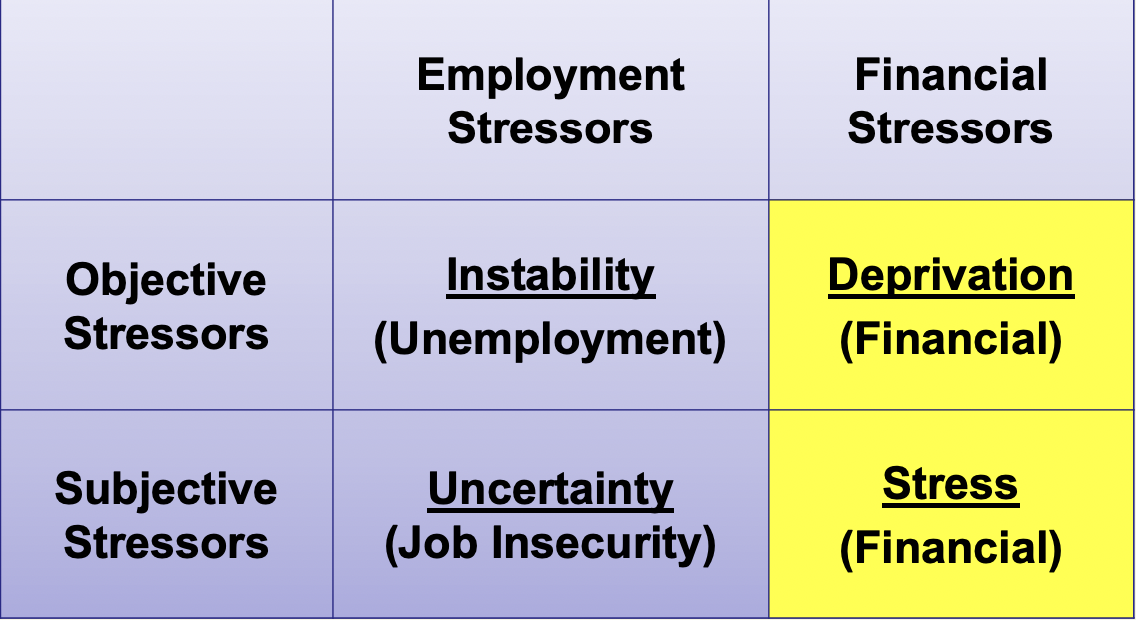
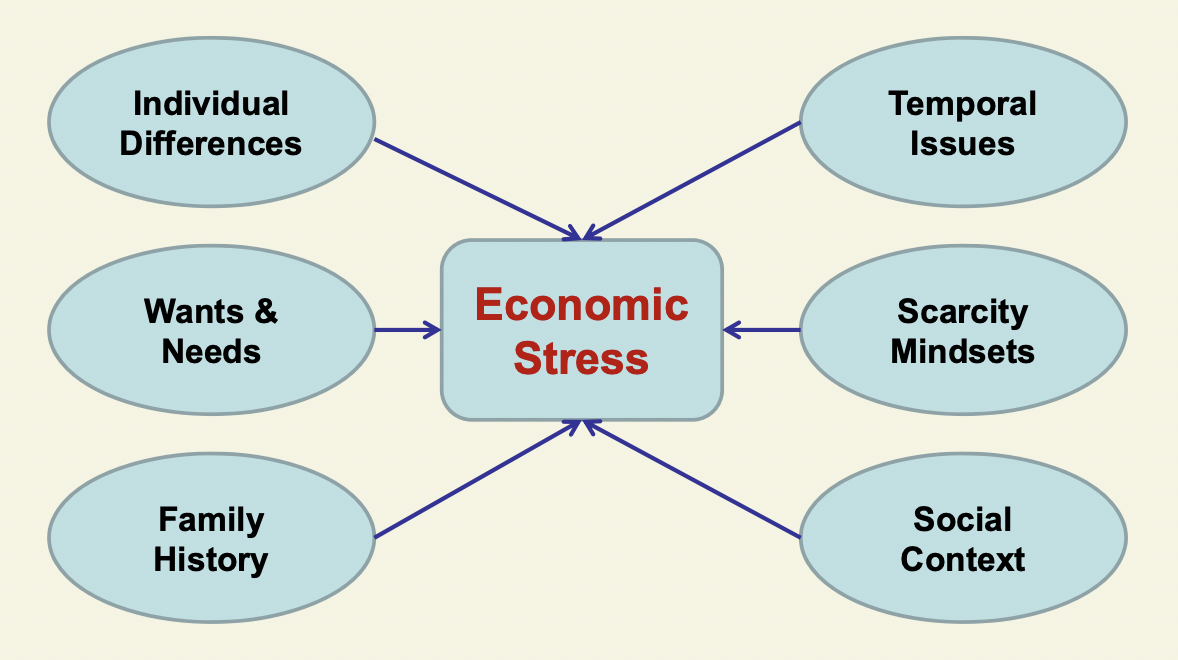
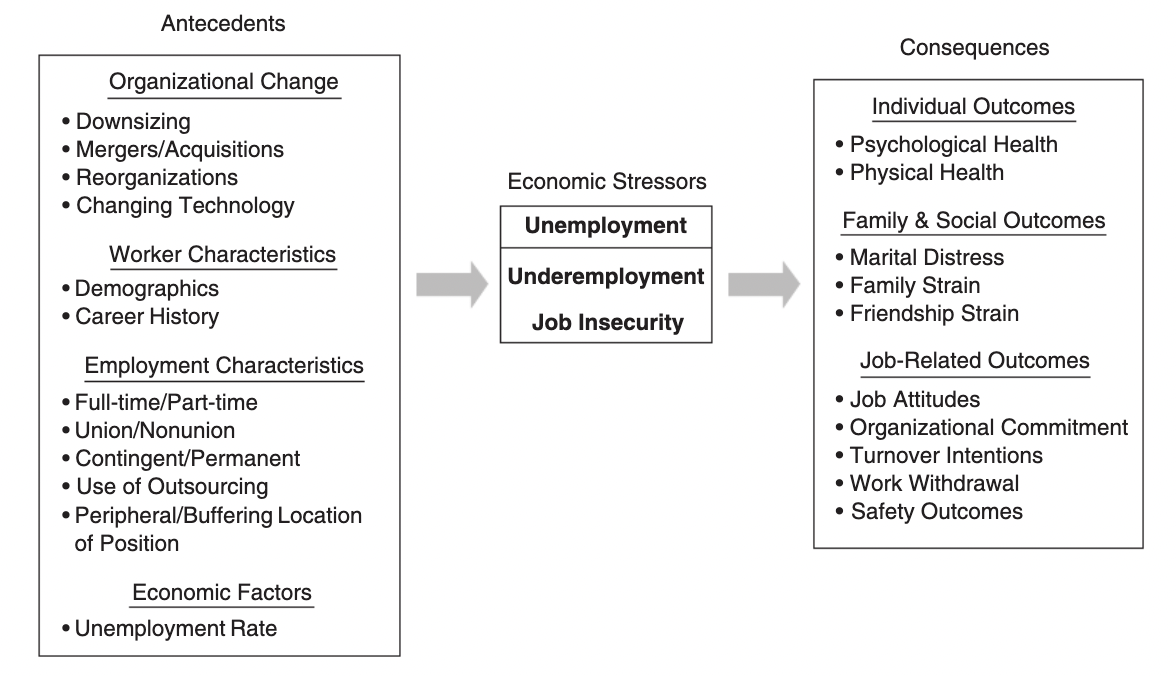
According to a Clemson University study, there are multiple dimensions of economic stress. The study explains that it is also important to consider the social context of a person who may be experiencing financial stress. A Washington State University study also provides a model of causes and consequences of economic stressors.
According to a 2005 study, the national unemployment rate and labor statistics do not take into account “marginally attached workers” or “discouraged workers”.
Marginal: unemployed individuals who want to work, but did not actively seek work during the 4-week period allotted by the government
Discouraged: those who were not currently looking for work due to a belief that there was no work available for them
Individuals that fall into either of these categories do not meet the government definition of unemployed, therefore would not be considered unemployed by most organizational researchers. Politicians, press, and the public largely focus on the national unemployment rate as the primary indicator of economic health, but many researchers would argue that underemployment may provide a more comprehensive and accurate measure of economic well-being in America.
underemployment as a stressor
(1) Assesses whether and to what extent an employee possesses more formal education than the position requires
(2) Evaluates whether the employee is more highly skilled and has more work experience than is required for the job (being “over-qualified for a job)
(3) Whether the person is involuntarily employed outside of his or her area of formal training
(4) Considers if the employee is involuntarily employed on a part-time, intermittent, temporary, or contingent basis
(5) Focus on the employee’s earnings - if wages are 20% less than had been earned previously or 20% less than a comparable cohort, the person is categorized as underemployed
Daniel C. Feldman (1996) proposed 5 criteria to determine the extent of an individual’s underemployment:
Labor underutilization rate as of May 2025:
People unemployed for 15 weeks or longer: 1.5%
People who lost their jobs or completed temporary jobs: 2.0%
Total unemployed: 4.2%
Total unemployed + discouraged workers: 4.5%
Total unemployed + discouraged workers + marginally attached: 5.1%
Total unemployed + discouraged workers + marginally attached + employed part time for economic reasons: 7.8%
Given the many subjective definitions of underemployment, it is difficult to determine a consensus regarding the prevalence of the issue. Although the government does not strictly define “underemployment”, it does measure and track “workforce underutilization”.
measuring economic stressors
Economic stress can be evaluated through direct and indirect financial measures:
Direct:
Salary/wages
Household income
Financial resources
Debt-to-asset rations
Income relative to cost of living
Indirect:
Family size
Adult dependents
variation by location
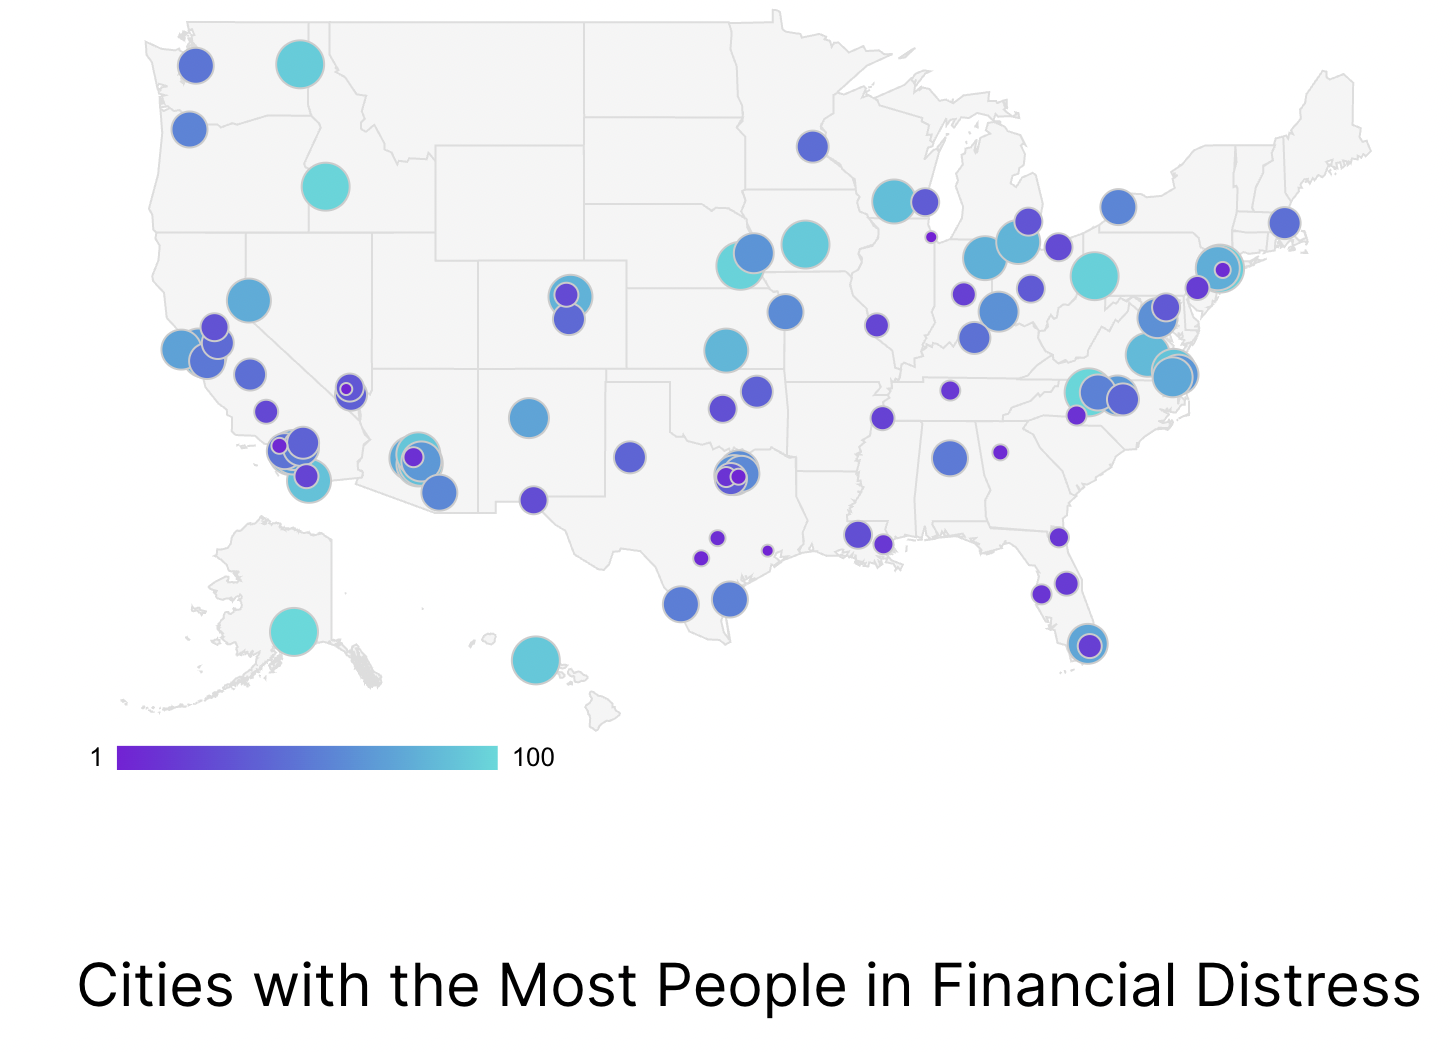
In 2025, WalletHub conducted a study to determine the US states with the most people in financial distress. To view the data table, click here.
The study analyzes factors like average credit score, the change in the number of bankruptcy filings between March 2024 and March 2025, and the share of people with accounts in distress. The analysis discusses the study’s main findings, an in-depth look at the most financially distressed states, and compares political views of each state. Based on the criteria of this study, 6 of 8 EPA Region 4 states are among the top 10 states facing financial distress.
Access to financial services & institutions
Click here to learn more about accessing financial services and institutions & strategies for navigating economic stress.

necessary literacy & educational attainment
It is important to have access to resources that can allow individuals to have the necessary literacy and education to effectively understand and utilize financial services, and to be eligible for more permanent and stable types of employment. Below you can find information about the intersections of education and unemployment rates, as well as resources for seeking education or navigating unemployment.
According to the U.S. Bureau of Labor Statistics, data show that for people 25 years and older, as educational attainment increases, unemployment rate decreases consistently over the last 20 years. According to a trend analysis of U.S. adults’ self-reported financial well-being done using the Consumer Financial Protection Bureau’s Financial Well-Being Scale, data suggests that while average financial well-being scores across the US population are quite stable, there are noticeable differences in average scores between different levels of educational attainment and household income each year, remaining consistent across time. Respondents with higher incomes and higher education were more likely to score higher on the financial well-being scale and were more likely to report higher quality of life.
National Strategy for Financial Inclusion in the United States
The strategy suggests financial inclusion through policy, education, and access to information. View the full report here.
According to the US Treasury Office of Consumer Policy, access to unbiased, clear, and relevant financial information, including plain-language product disclosures, information about consumer rights and recourse options, and educational resources, equips consumers to make informed financial decisions in line with their life circumstances, experiences, and goals.
A study on the state of financial literacy among US adults found a positive relationship between financial literacy and financial well-being indicators when considering:
-Ability to make ends meet
-Ability to manage debt
-Ability to have and manage emergency savings
Having tax literacy is important to informed financial decision-making. A lack of basic financial knowledge can be costly to consumers who are unable to engage in effective tax-planning, benefit from tax credits or deductions, and avoid penalties.
Next Steps:
Policymakers, financial institutions, educators, employers, community organizations, and researchers play an important role in the development, delivery, and measurement of efforts to provide financial information and resources to consumers.
In addition to evaluating their materials and programming, organizations that provide financial information should evaluate the communication channels they use to reach consumers. Many young consumers indicate that they seek financial information from social media platforms, suggesting that educators should consider leveraging those platforms for the delivery of financial information and educational resources.
The government can consider hosting regional financial fairs and conducting workshops in libraries, community centers, and places of worship to provide information and resources to consumers on their financial rights and responsibilities.
Financial education should equip consumers with tools to assert their rights, identify fraudulent activity, and seek help if they are in financial distress.

The Interagency Financial Literacy and Education Commission has identified multiple best practices for financial educators:
-Ensuring that financial education materials are accessible to diverse communities and offered in plain language (avoids jargon)
-Timing the delivery of financial information to when it is of most use to consumers
-Leveraging tailored approaches like financial coaching or the delivery of customized information on digital and scalable platforms
-Integrating financial information and education into academic content starting at an early age
-As of 2024, 26 US states require students to take a personal finance course to graduate from high school