
Degree of Vulnerability to Displacement, Relocation, and Gentrification
People have a right to remain in their homes and communities without being pushed out by rising costs or redevelopment. Gentrification and displacement occur when housing markets shift—often increasing property values and investment—but forcing out long-term residents, especially low-income households and communities of color. Here you will find data sources and tools to understand and measure this issue and track patterns of displacement over time.

Gentrification
Gentrification is a process of neighborhood change where rising housing costs, new investment, and demographic or economic shifts can affect who is able to live in and remain connected to a place. It can bring improvements like new services, parks, street trees, paving, and higher property values, but the benefits and burdens are not shared equally. Renters, lower-income homeowners, and longtime residents may face displacement pressure, rising property taxes, or loss of community identity.
Gentrification is sometimes understood as a partial reversal of historic white flight, as new investment and higher-income residents move into previously disinvested urban neighborhoods.
Some residents may benefit from rising property values or improved services, especially existing homeowners.
Other residents may be harmed if rising rents, taxes, or home prices make it difficult to stay in the neighborhood.
Community change can also affect residents who remain, especially when familiar businesses, social networks, cultural institutions, or neighborhood identity begin to disappear.
Gentrification is not always viewed the same way by newcomers, longtime homeowners, renters, business owners, and local governments.
Data & Measurement
Gentrification is usually measured by looking at changes in housing costs, income, property values, demographics, and neighborhood investment over time. These data points do not prove gentrification alone, but they can help identify where displacement risk and rapid neighborhood change may be occurring.
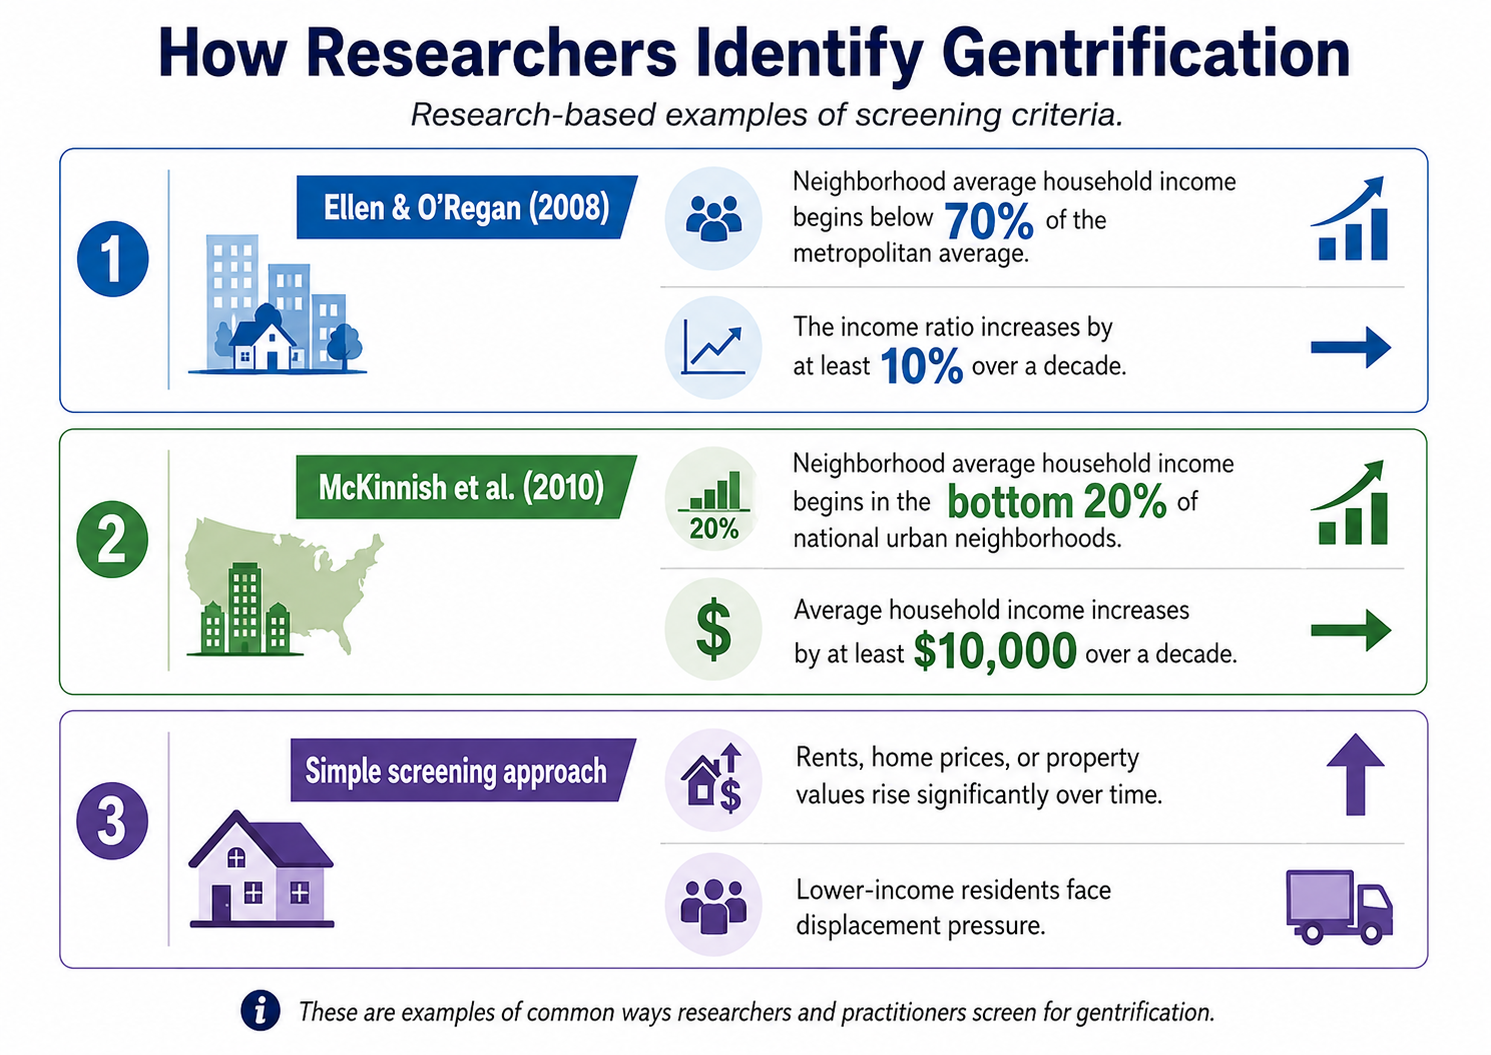
Research-Based Measurement Examples
Ellen and O’Regan define a neighborhood as gentrifying when its average household income begins below 70% of the metropolitan average and increases by at least 10% over a decade.
McKinnish et al. define gentrification as occurring when a neighborhood begins in the bottom 20% of national urban neighborhoods by income and average household income increases by at least $10,000 over a decade.
A simpler screening approach is to look for neighborhoods where rents, home prices, or property values increase significantly over time, especially when lower-income residents face rising displacement pressure.
Questions the Data Can Help Answer
Are rents, home prices, or property values increasing quickly?
Are housing costs rising faster than household incomes?
Are lower-income residents or renters becoming less able to stay?
Are property tax burdens increasing for longtime homeowners?
Are neighborhood demographics changing over time?
Are new developments, services, or investments changing the area?
Are residents reporting displacement, cultural loss, or reduced sense of belonging?
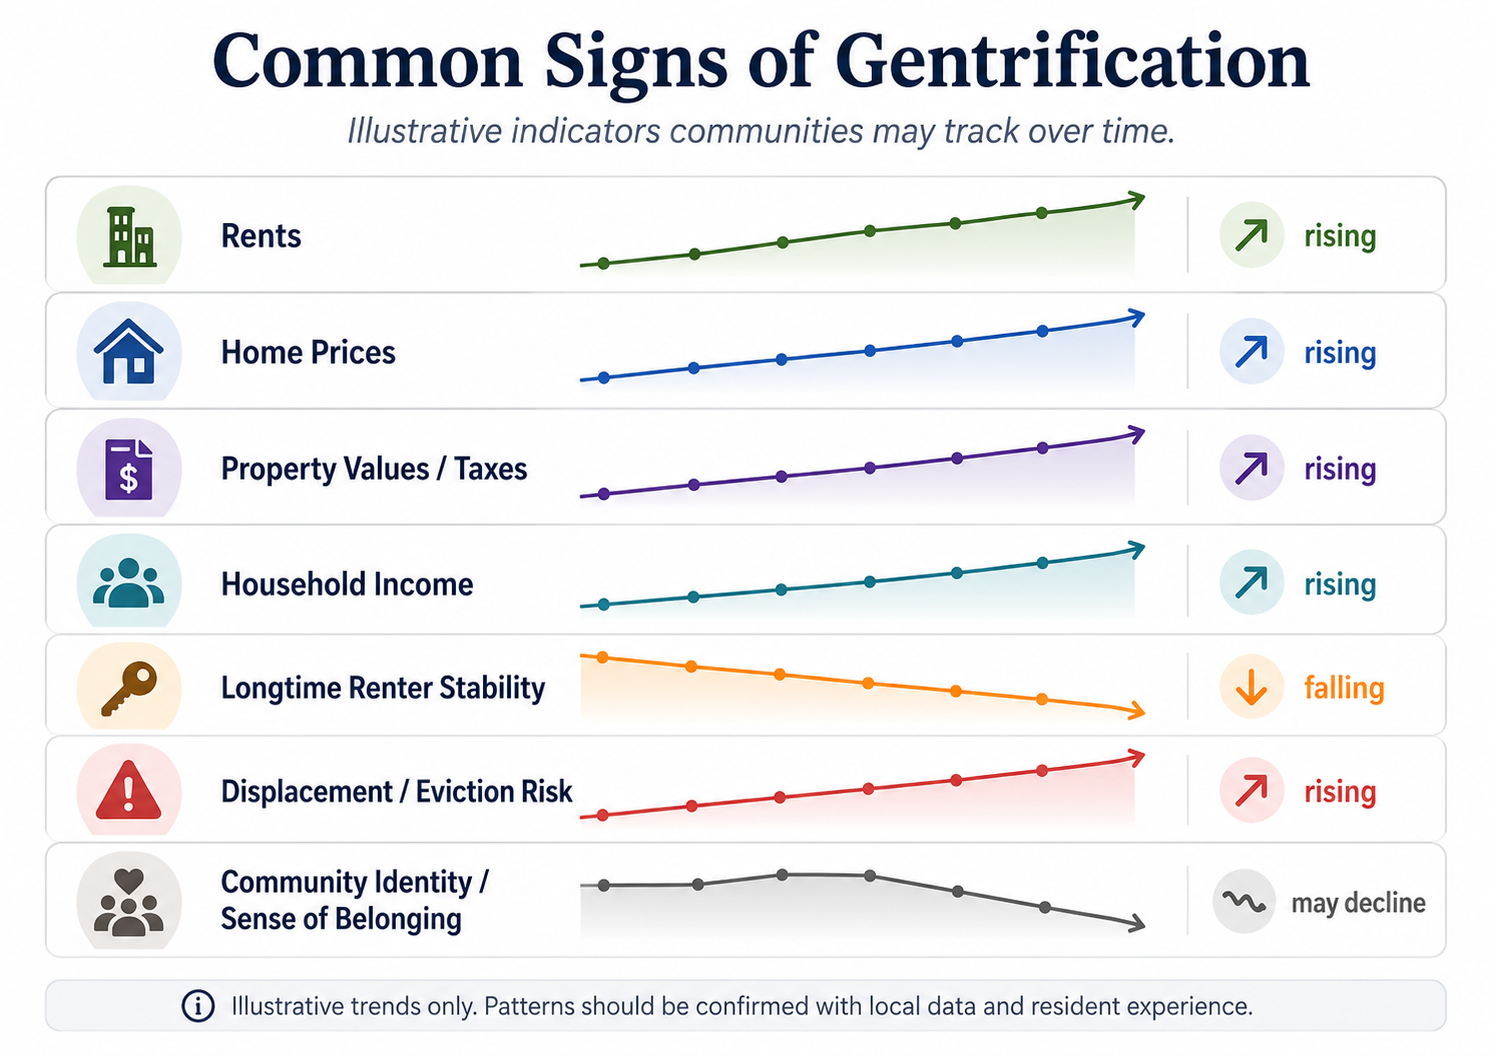
Key Data Indicators to Look For
Rent increases
Home sale price increases
Property value changes
Property tax changes
Household income shifts
Renter versus homeowner changes
Race, ethnicity, age, and education changes
New development, permits, or investment activity
Eviction, foreclosure, or displacement risk data
Resident experiences and community testimony
GENTRIFICATION AND NEIGHBORHOOD CHANGE DATA
U.S. CENSUS BUREAU – AMERICAN COMMUNITY SURVEY (ACS)
What this tool shows:
Demographic changes
Housing trends
Economic conditions
This dataset includes:
Median household income
Median rent
Median home value
Educational attainment
Race and ethnicity
Poverty rates
Housing tenure (owner vs. renter occupied)
Population change
Housing cost burden
The American Community Survey is the Census Bureau’s largest ongoing survey and provides annual demographic, economic, social, and housing data used to identify neighborhood change, displacement vulnerability, and gentrification trends.
Instructions: Open data.census.gov → enter a desired location in the search bar → select a geography level (nation, state, county, city, or census tract) → search for variables such as median rent, median home value, educational attainment, household income, or race and ethnicity → review tables and visualizations → download data using the “Download” button → compare data across years to identify neighborhood change and potential gentrification patterns.
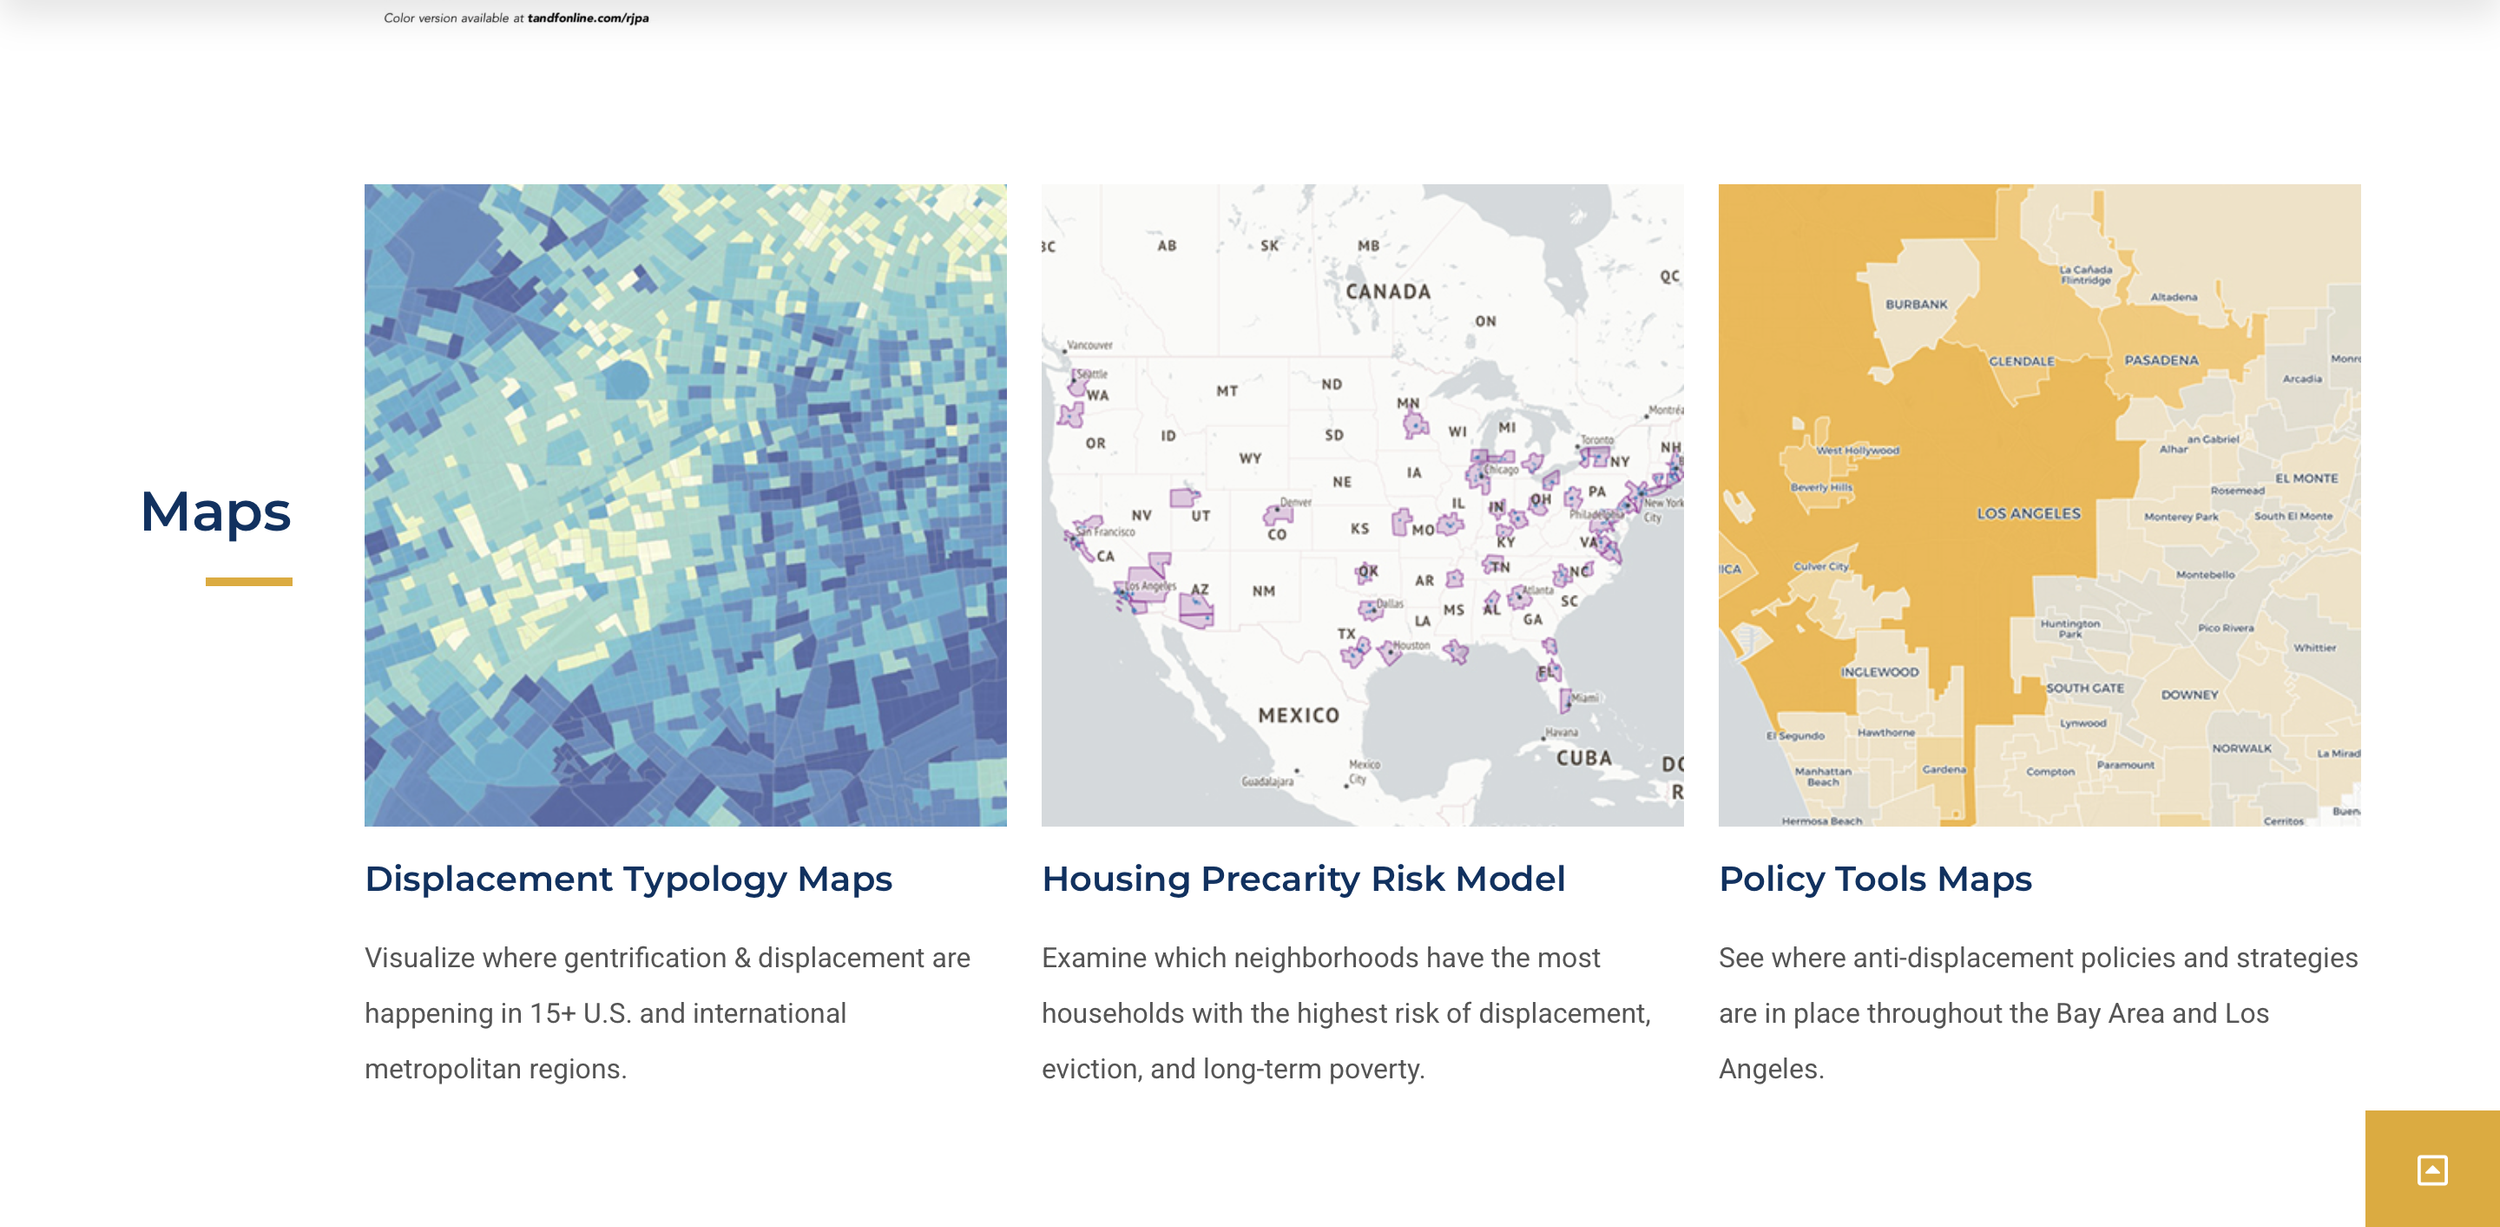
NCRC – Displaced by Design
NCRC – Displaced by Design: The Gentrification Machine and its Human Costs Interactive Map
What this tool shows:
National trends in gentrification and displacement across metro areas
Number of gentrified census tracts over time
Demographic changes linked to gentrification
Population shifts by race in areas experiencing displacement
This dataset includes:
Bar graphs of gentrified census tracts
Line graphs of population change by race
Indicators including:
Income
Home value
Education
Population demographics
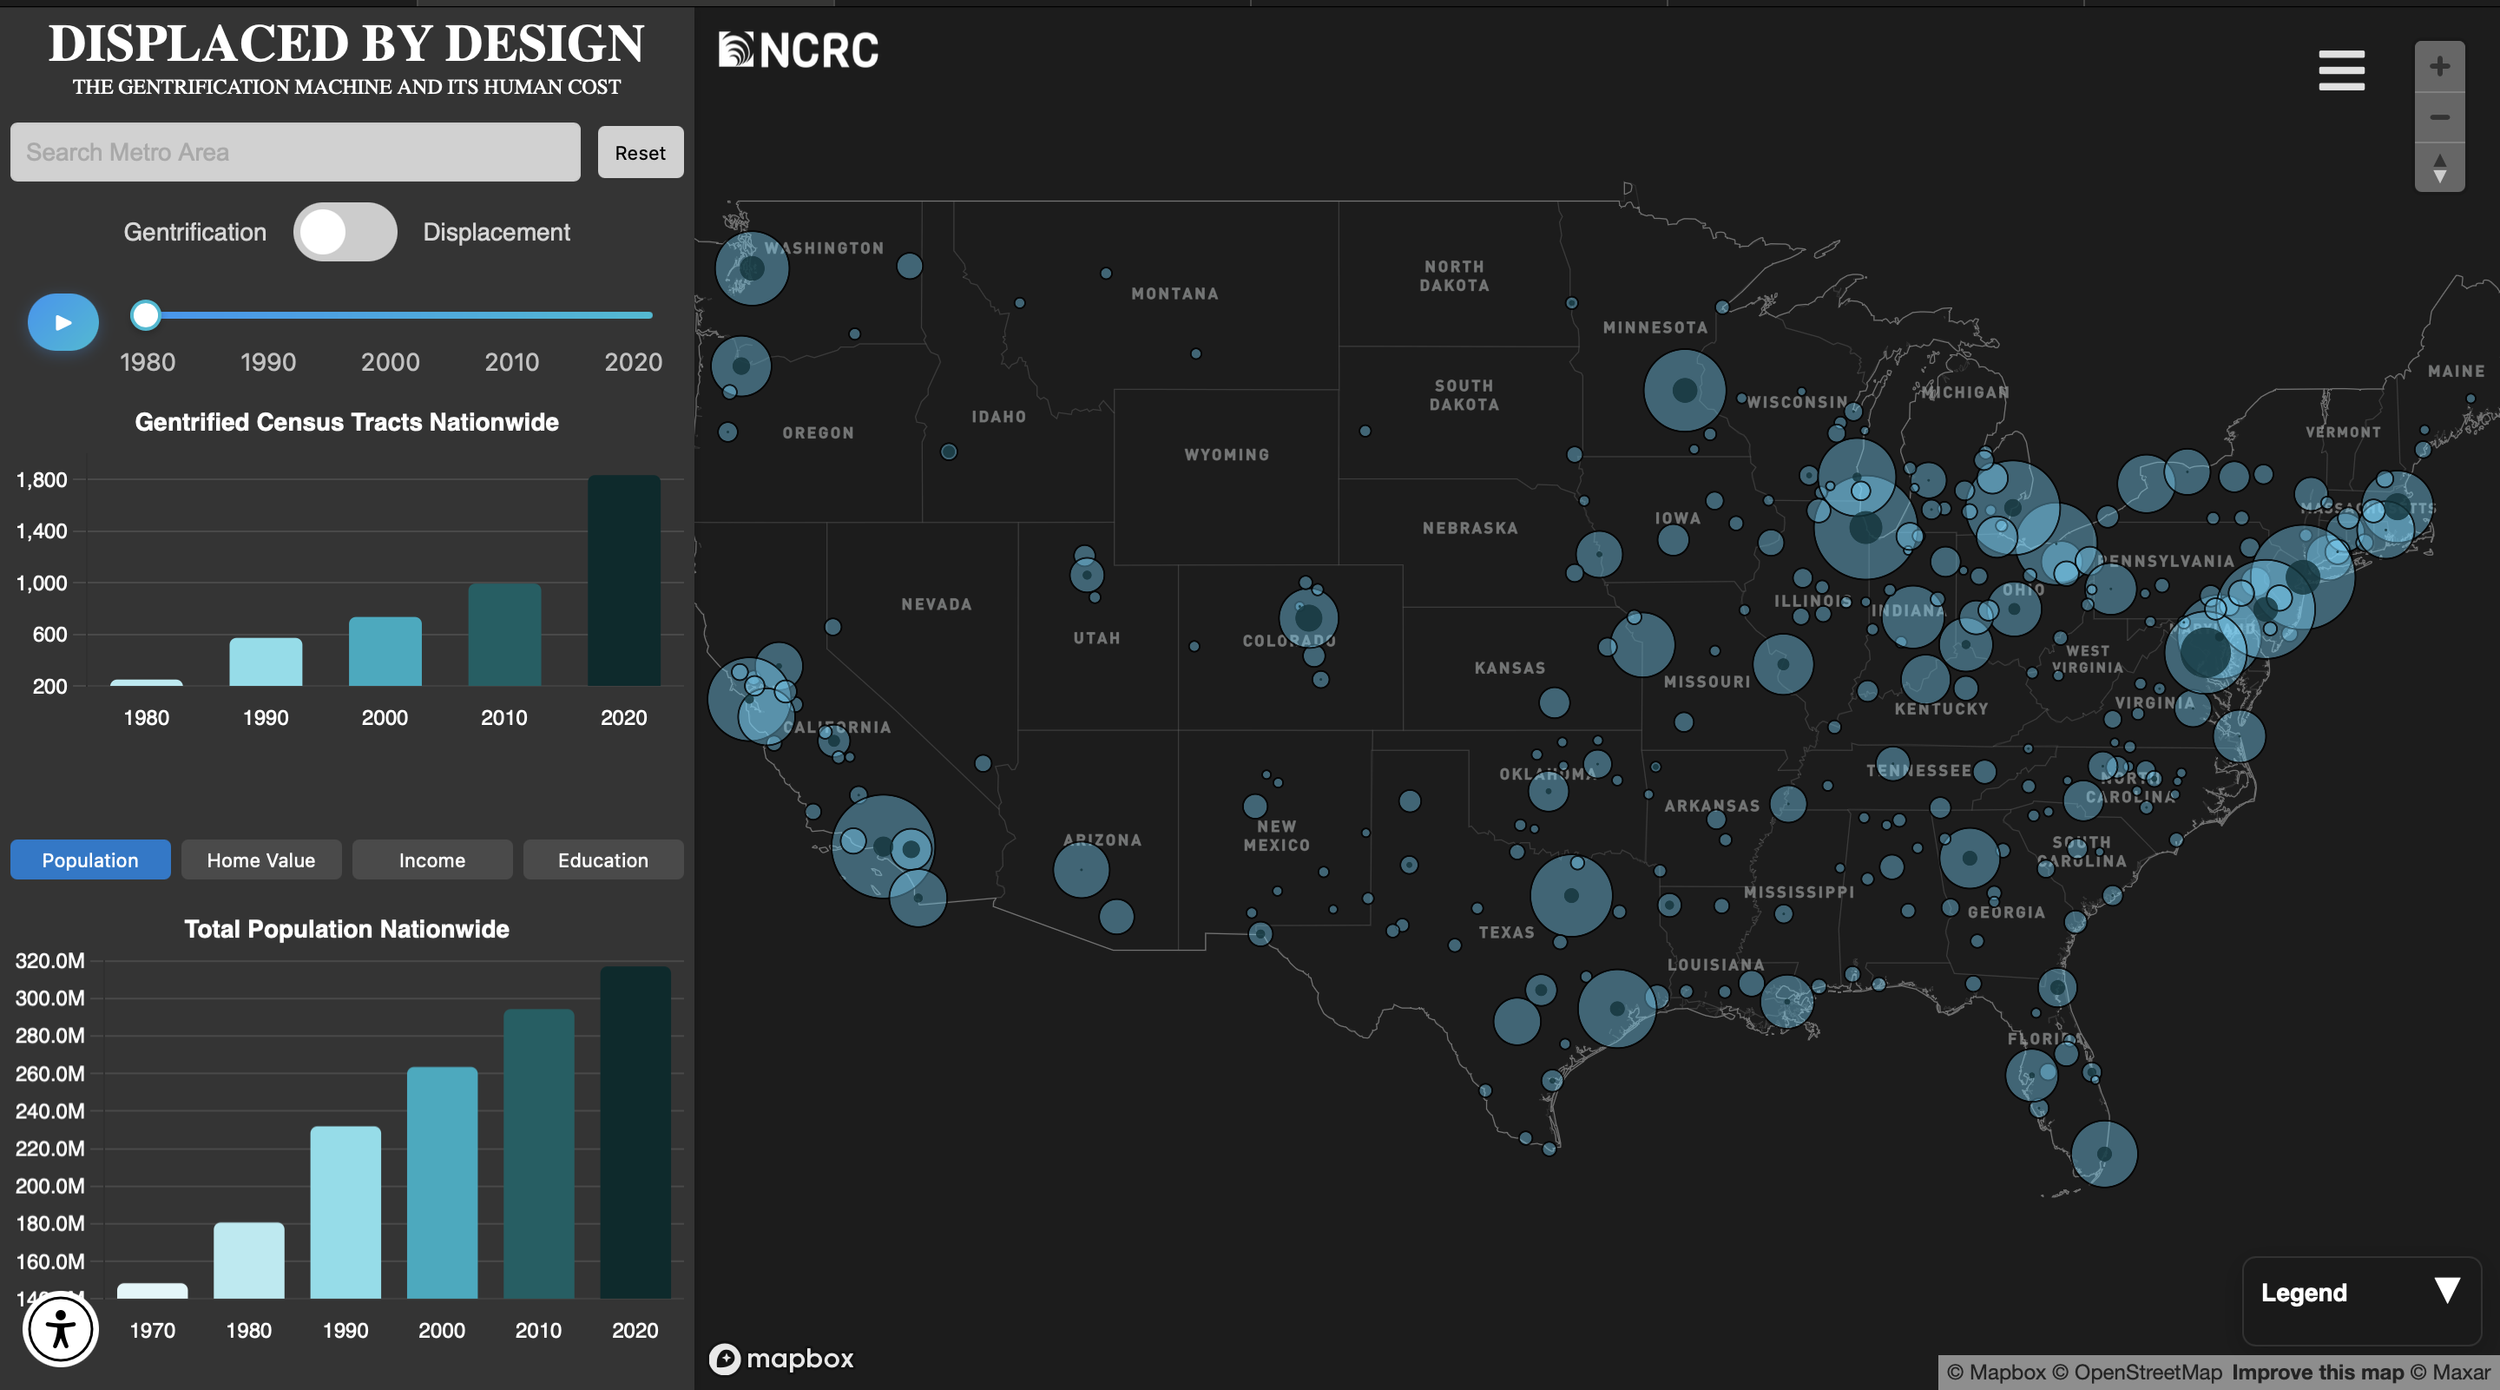
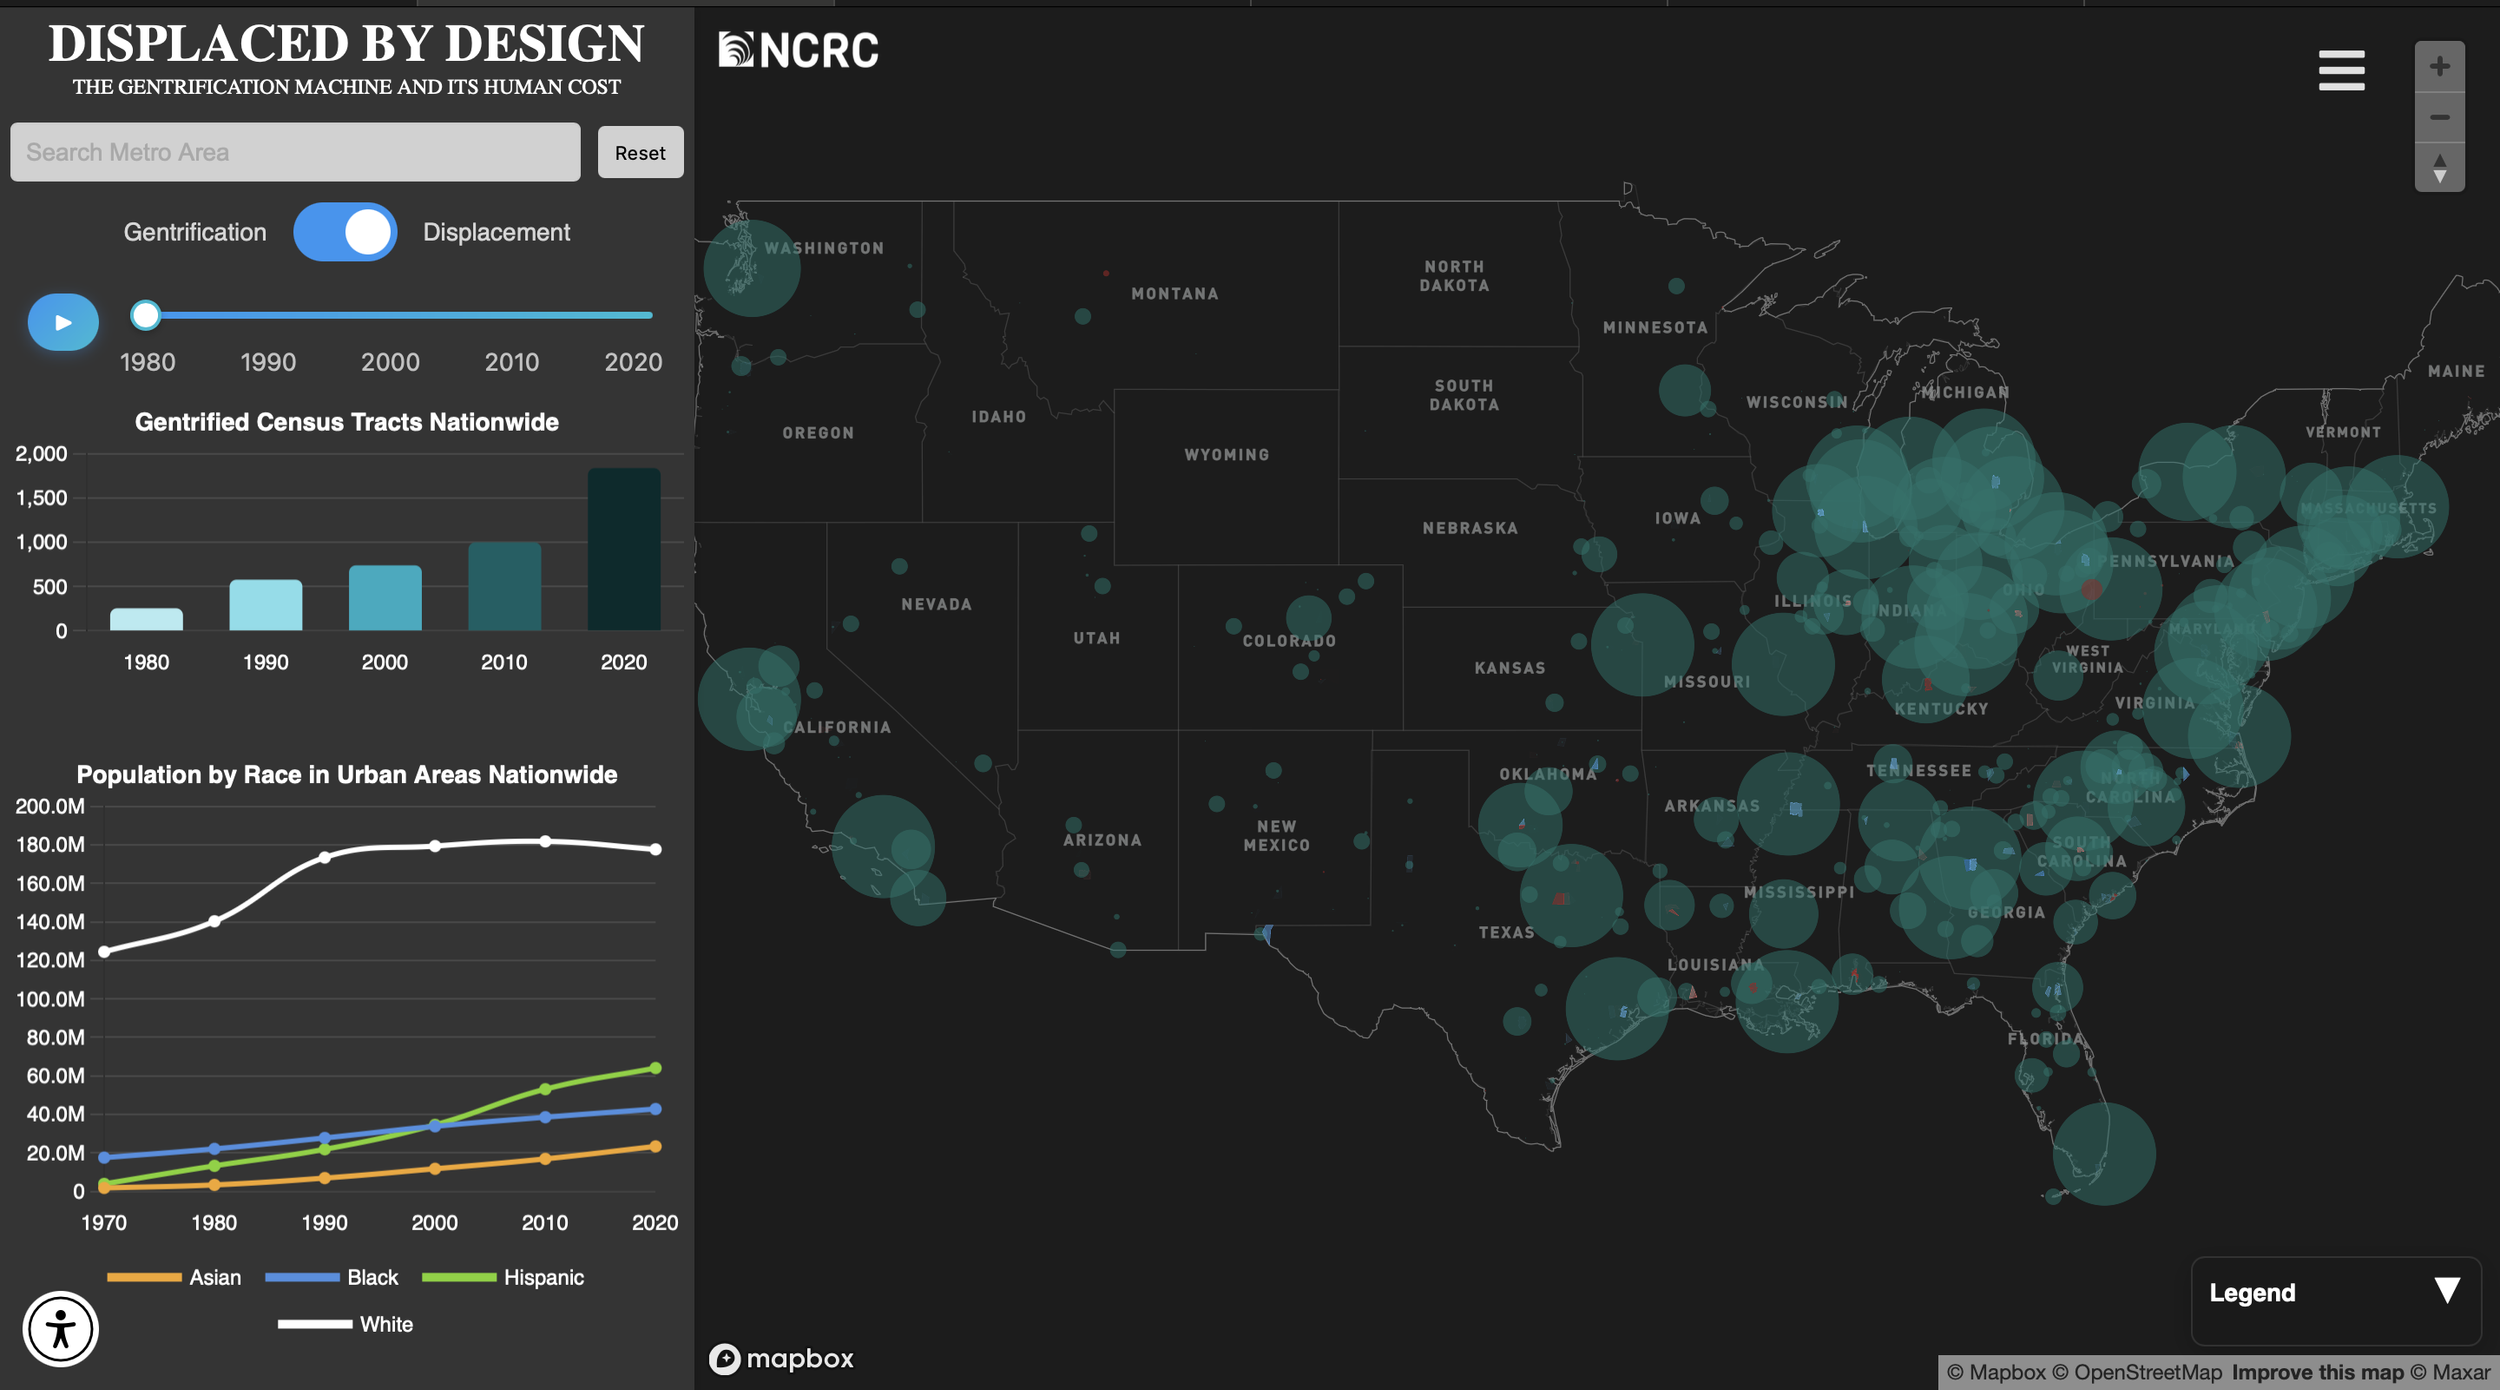
Instructions:
Open NCRC Displaced by Design Interactive Map (https://ncrc.org/gd/) → type location in “Search Metro Area” → select metro area from dropdown → toggle between “Gentrification” or “Displacement” at top left → for gentrification: adjust timeline using blue slider → observe bar graph showing number of gentrified tracts → hover over each bar for exact counts → use buttons at bottom left (“Population,” “Home Value,” “Income,” “Education”) to switch datasets → hover over graph points to view exact demographic values → compare changes over time → for displacement: switch toggle → adjust timeline → review line graph showing population by race → hover over lines to see exact population changes → identify which groups are most impacted over time
Urban Displacement Project – Displacement Typology Map
What this tool shows:
Stages of gentrification and displacement by neighborhood
This dataset includes:
Typologies such as:
Low-income stable
At risk of displacement
Ongoing displacement
Advanced gentrification
Market dynamics
Demographic shifts
Housing pressure indicators
Instructions:
Open Urban Displacement Project → scroll to Maps section → select “Displacement Typology Map” → choose region → zoom using + or – → consult color-coded legend → click on neighborhood → review breakdown including typology, demographics, and market pressures → compare nearby tracts to understand displacement progression
ArcGIS Gentrification Intensity Map
ArcGIS Gentrification Intensity Map
What this tool shows:
Gentrification intensity scores across the U.S. from 1990–2020
Local to national scale analysis
This dataset includes:
Composite gentrification intensity score based on:
Income changes
Housing value increases
Demographic shifts
Color-coded map with detailed area comparisons
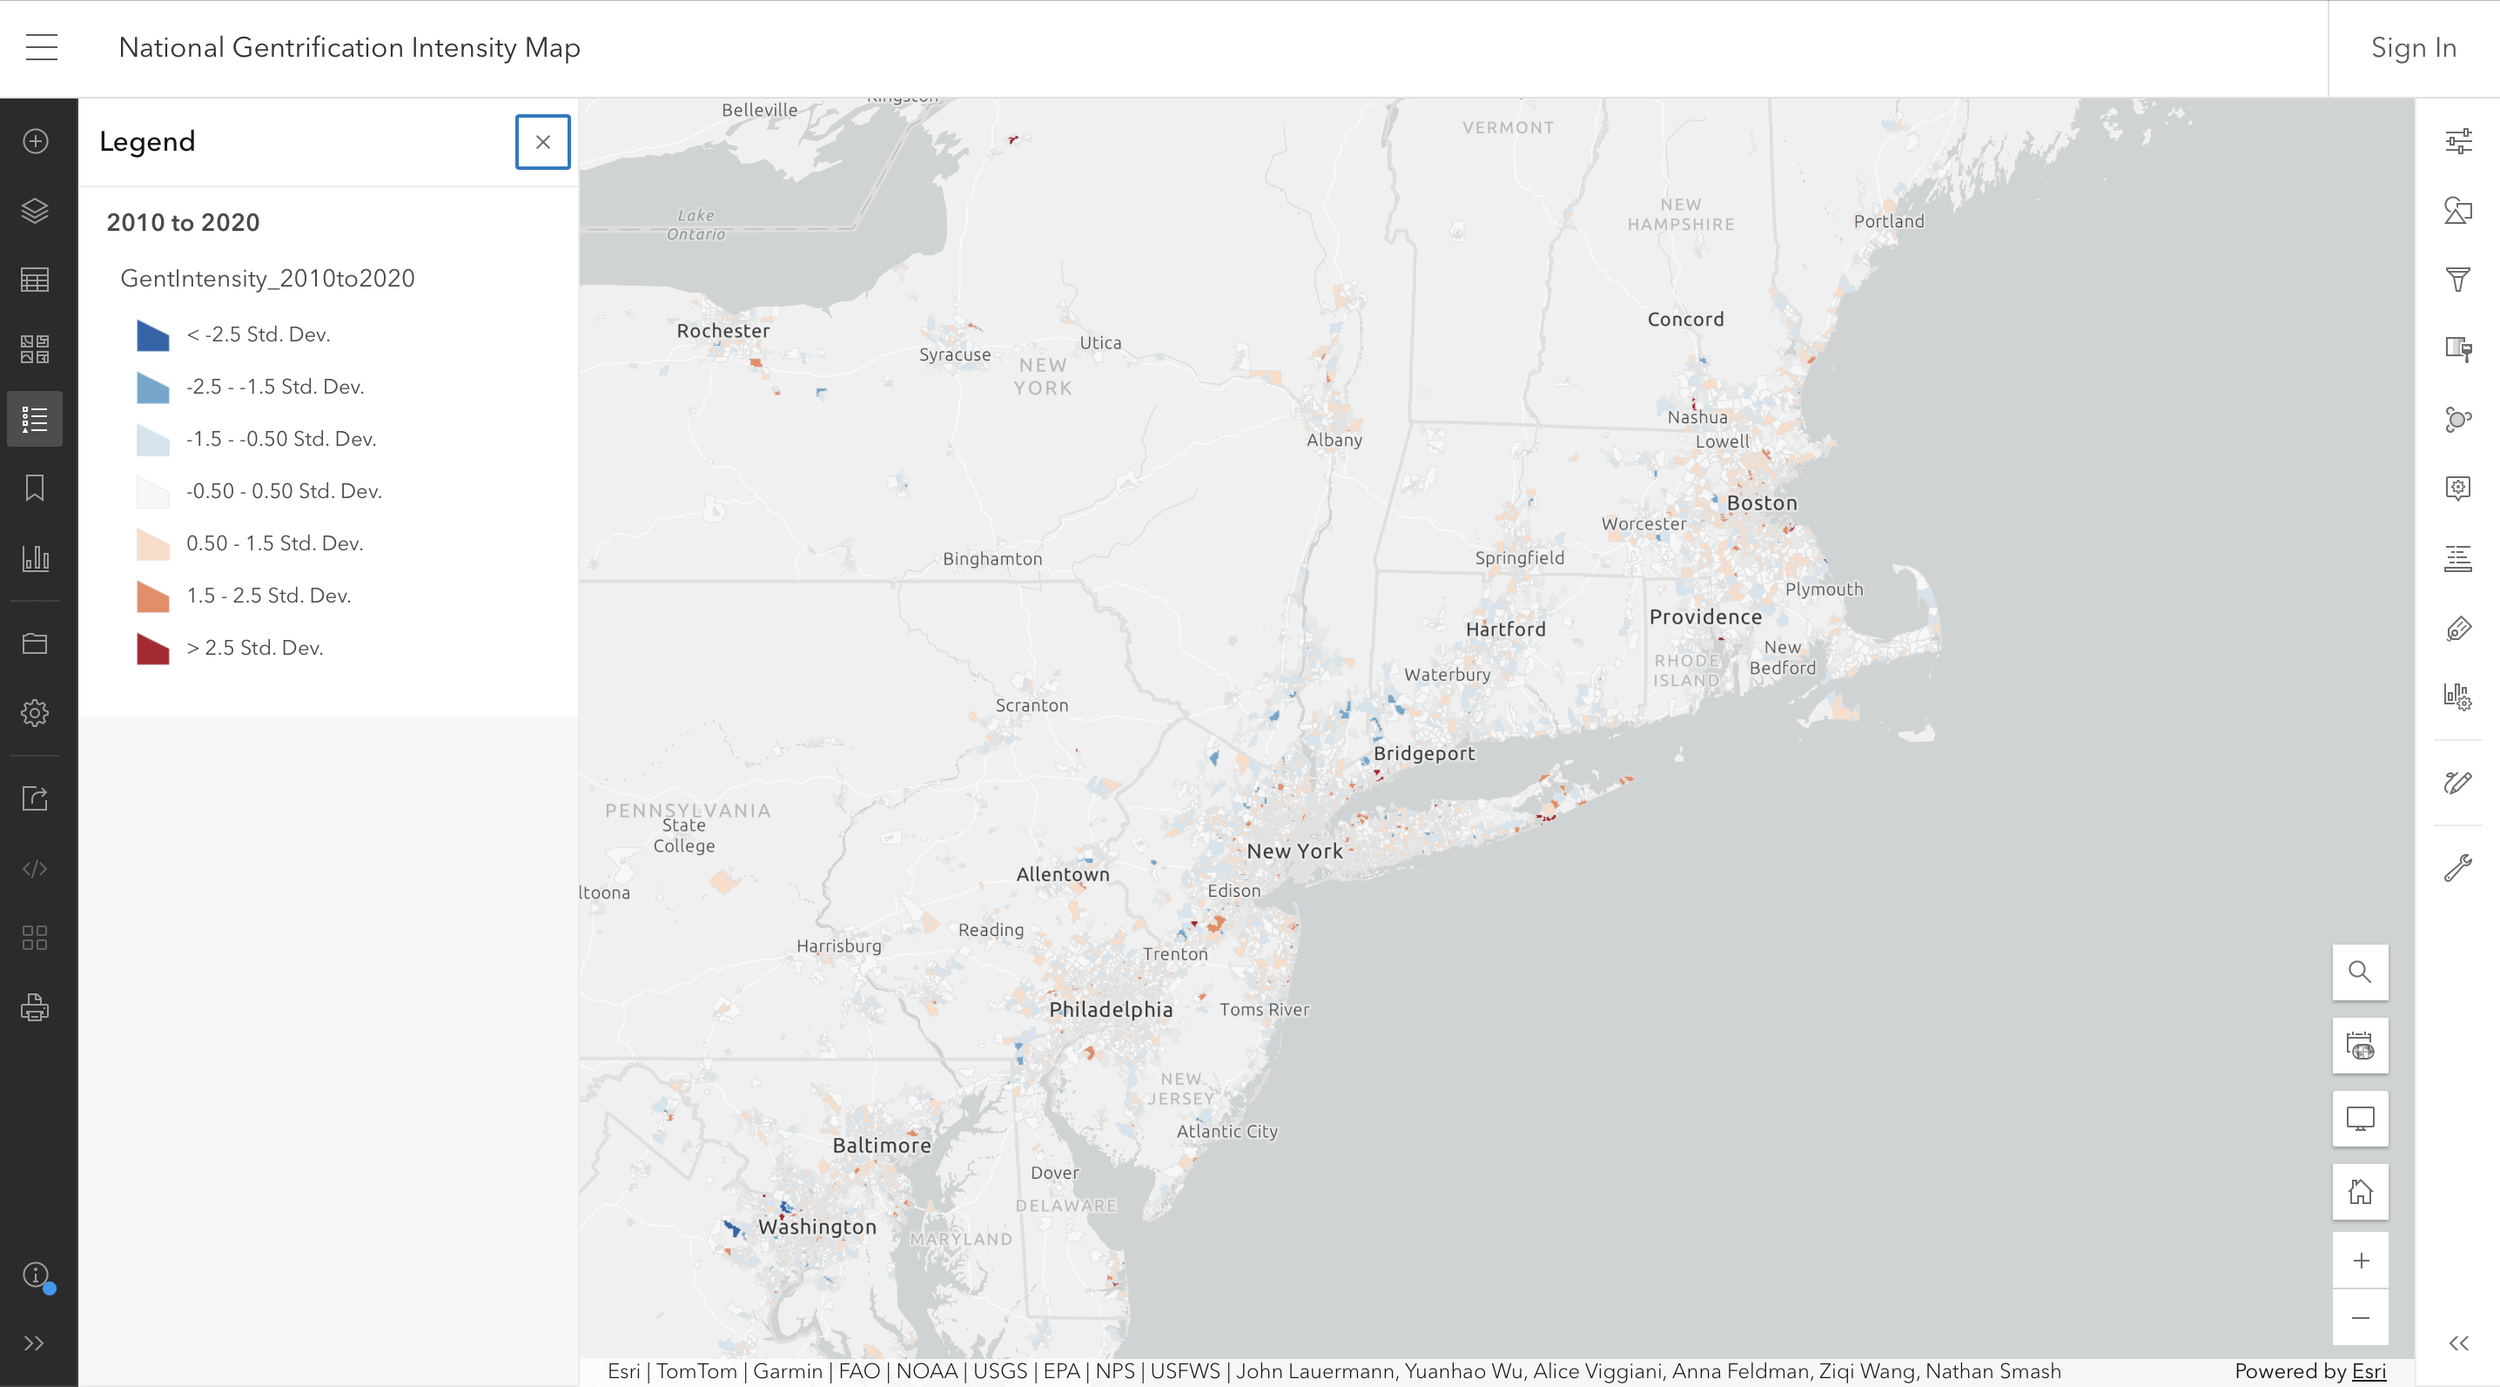
Instructions: Open ArcGIS Gentrification Intensity Map→ use + or – in bottom right to zoom or type location in search bar → navigate to desired neighborhood, city, or state → consult legend on left side to understand intensity scale → identify color of selected tract → click directly on map area → review pop-up showing exact intensity score → read explanation of how score compares to surrounding areas → analyze contributing indicators listed in pop-up → zoom in further for neighborhood-level analysis or zoom out for regional comparison → repeat across nearby areas to identify patterns of concentrated gentrification
FEDERAL HOUSING FINANCE AGENCY (FHFA) HOUSE PRICE INDEx
What this tool shows:
Housing market trends
Home value appreciation
Housing price growth over time
This dataset includes:
Home Price Index values
Quarterly home price changes
Annual home price changes
State-level data
County-level data
Metropolitan statistical area data
Historical housing market trends
The FHFA House Price Index measures changes in single-family home values across the United States and is commonly used to identify areas experiencing rapid housing appreciation associated with gentrification and displacement pressures.
Instructions: Open FHFA House Price Index → select “Interactive Data” or “House Price Index Datasets” → choose a geography level (state, county, or metropolitan area) → select a desired date range → review charts and tables showing housing price changes → compare locations and time periods to identify areas experiencing rapid appreciation and potential gentrification pressure.
DISPLACEMENT, EVICTION, AND HOUSING INSTABILITY DATA
Migration Data Portal – Global Trends in Forced Displacement
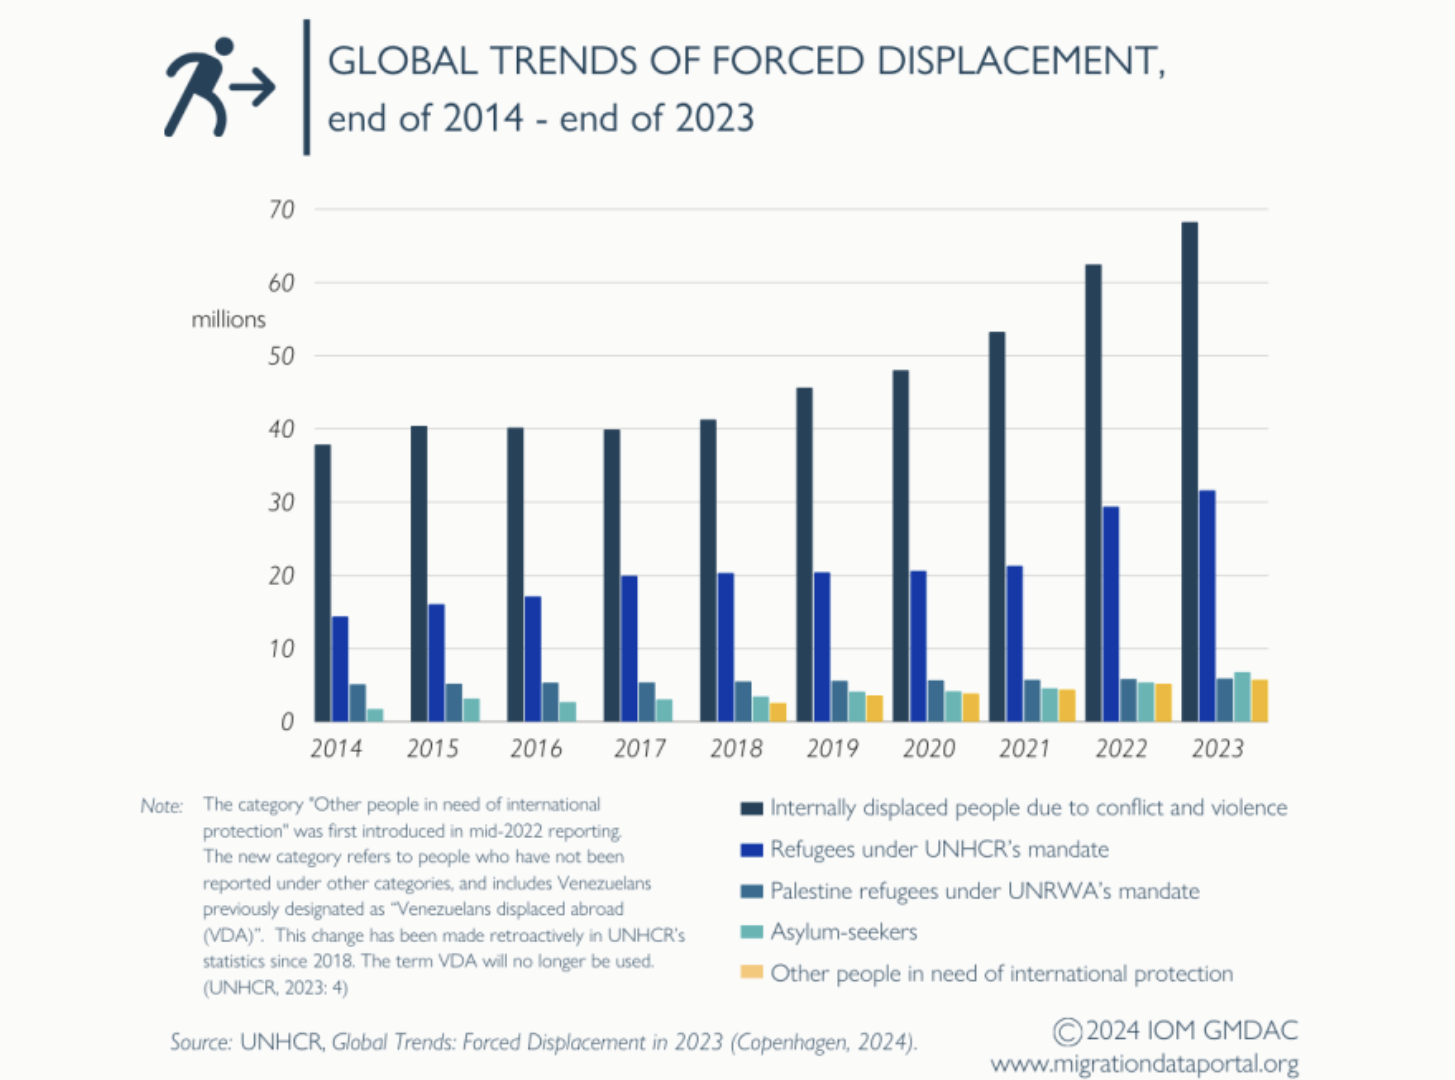
Instructions: Open Migration Data Portal – Forced Migration and Displacement → locate “Key Trends” section → review bar graph of global displacement categories → scroll to line graphs → analyze trends over time → hover over data points for exact values → compare regions using regional graph → identify which regions and categories show the greatest increases
What this tool shows:
Global displacement trends from 2014–2023
This dataset includes:
Internally displaced persons due to conflict
Refugees under UNHCR mandate
Palestine refugees under UNRWA
Asylum seekers
Other populations in need of protection
Regional trends across Africa, Americas, Europe, Asia, and Oceania
Eviction Lab – National Eviction Data
Overview:
Eviction Lab provides one of the most detailed datasets on housing instability in the United States. Evictions are often one of the earliest indicators of displacement, as rising housing costs force residents out of their homes. This tool helps identify where renters are most vulnerable and where displacement pressures are strongest.
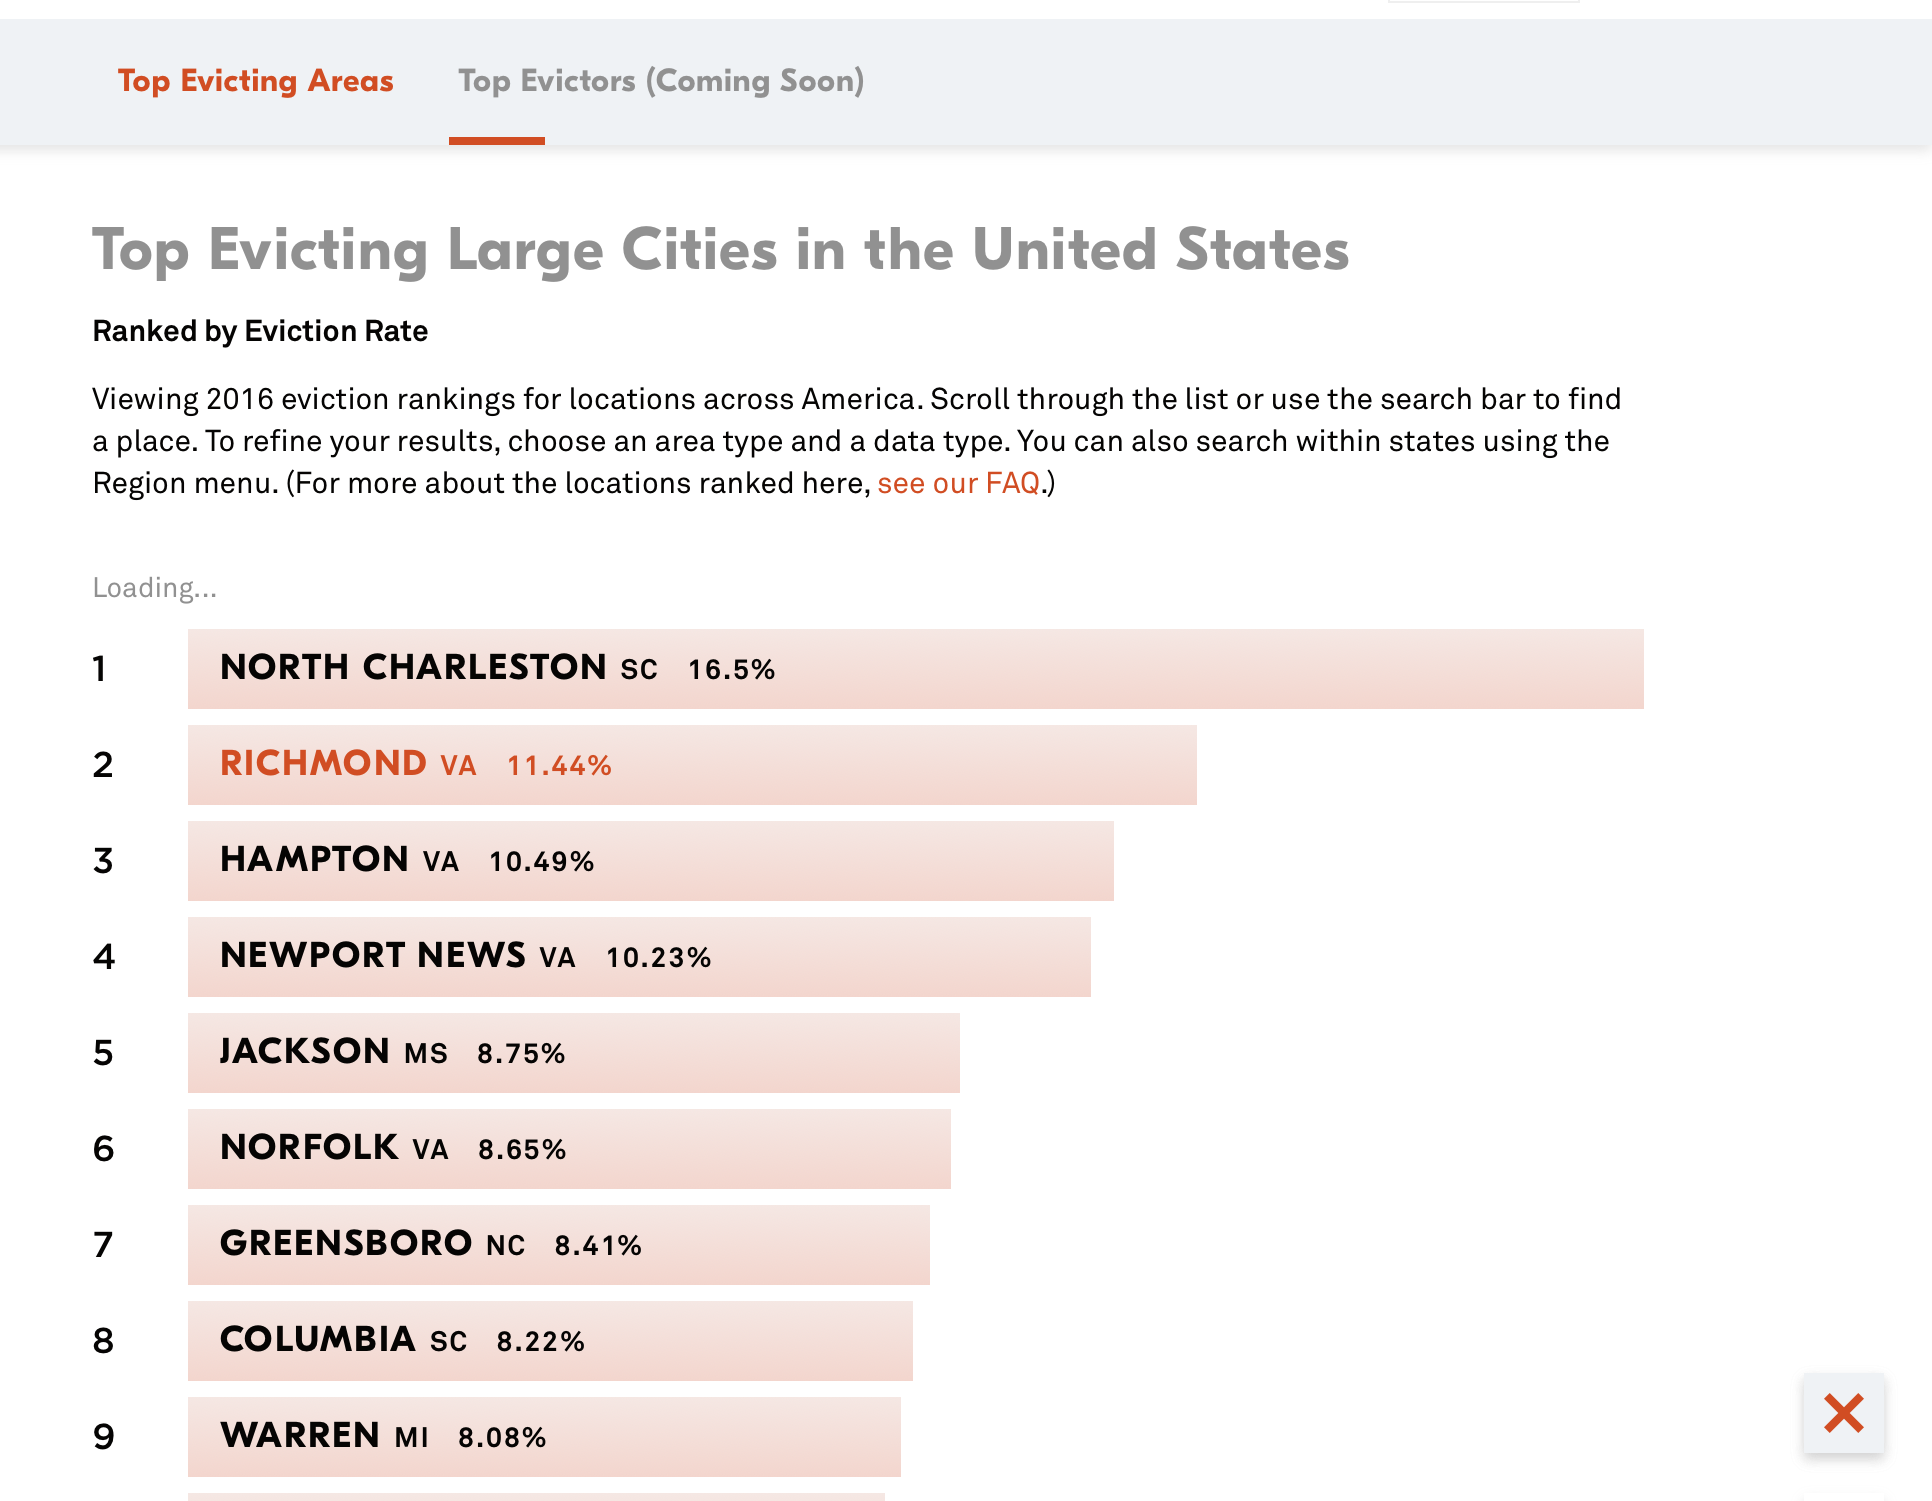
What This Dataset Includes:
• Eviction filing rates by city, county, and state
• Historical eviction trends over time
• Rent burden and housing instability indicators
• Regional comparisons
• Data on renter vulnerability
Instructions: Open Eviction Lab (https://evictionlab.org/) → click “Explore Data” → enter a city, county, or state → select your location → view eviction rate and filing data at the top → scroll to see trends over time → hover over graphs for exact values → switch between rate and filings to compare → use the map to identify higher-risk areas → compare your location to state and national averages → use patterns to assess displacement risk
ANTI-EVICTION MAPPING PROJECT
What this tool shows:
Eviction patterns
Displacement trends
Housing insecurity
Neighborhood change
This dataset includes:
Eviction trends
Displacement indicators
Housing insecurity measures
Demographic changes
Community displacement histories
Oral histories and community narratives
Neighborhood-level mapping resources
The Anti-Eviction Mapping Project is a community-based research and storytelling platform that documents displacement, eviction, housing insecurity, and neighborhood change through maps, reports, and public data resources.
Instructions: Open Anti-Eviction Mapping Project → select an available map or data project → navigate to a desired location using map controls → consult legends and data layers → click directly on neighborhoods or geographic areas for additional information → compare communities experiencing higher levels of displacement pressure and housing instability.
NATIONAL LOW INCOME HOUSING COALITION – OUT OF REACH
What this tool shows:
Rental affordability
Housing cost burden
Housing wage estimates
This dataset includes:
Housing wage
Fair Market Rent
Rent burden
Affordability gaps
State rankings
County-level affordability estimates
Income needed to afford rental housing
Out of Reach is an annual housing affordability report produced by the National Low Income Housing Coalition that measures the gap between wages and rental housing costs across the United States.
Instructions: Open Out of Reach → select a desired state from the interactive map or report tables → review housing wage and Fair Market Rent estimates → compare affordability across states and regions → download reports and tables for additional analysis of affordability pressures and displacement risk.
HOUSING PRESERVATION AND COMMUNITY OPPORTUNITY DATA
NATIONAL HOUSING PRESERVATION DATABASE (NHPD)
What this tool shows:
Affordable housing locations
Preservation risk
Subsidized housing inventory
This dataset includes:
Public housing developments
Section 8 properties
Low-Income Housing Tax Credit (LIHTC) properties
Property locations
Number of affordable units
Subsidy expiration dates
Housing preservation risk indicators
The National Housing Preservation Database is a national inventory of federally assisted affordable housing properties. It helps identify communities where affordable housing may be at risk of being lost due to expiring subsidies, redevelopment, or market pressures.
Instructions: Open National Housing Preservation Database → use the search bar to enter a city, county, state, or ZIP code → zoom in or out using the + and – buttons → click directly on a property point on the map → review information including property name, affordable housing program, number of units, and subsidy expiration date → compare nearby properties to identify concentrations of affordable housing and potential preservation risks.
OPPORTUNITY ATLAS
What this tool shows: The Opportunity Atlas provides census tract-level data on economic mobility and long-term outcomes, helping users understand how neighborhood conditions affect future earnings and opportunities.
This dataset includes:
Income outcomes
Employment outcomes
Neighborhood poverty rates
Educational attainment measures
Census tract-level opportunity indicators
Demographic characteristics
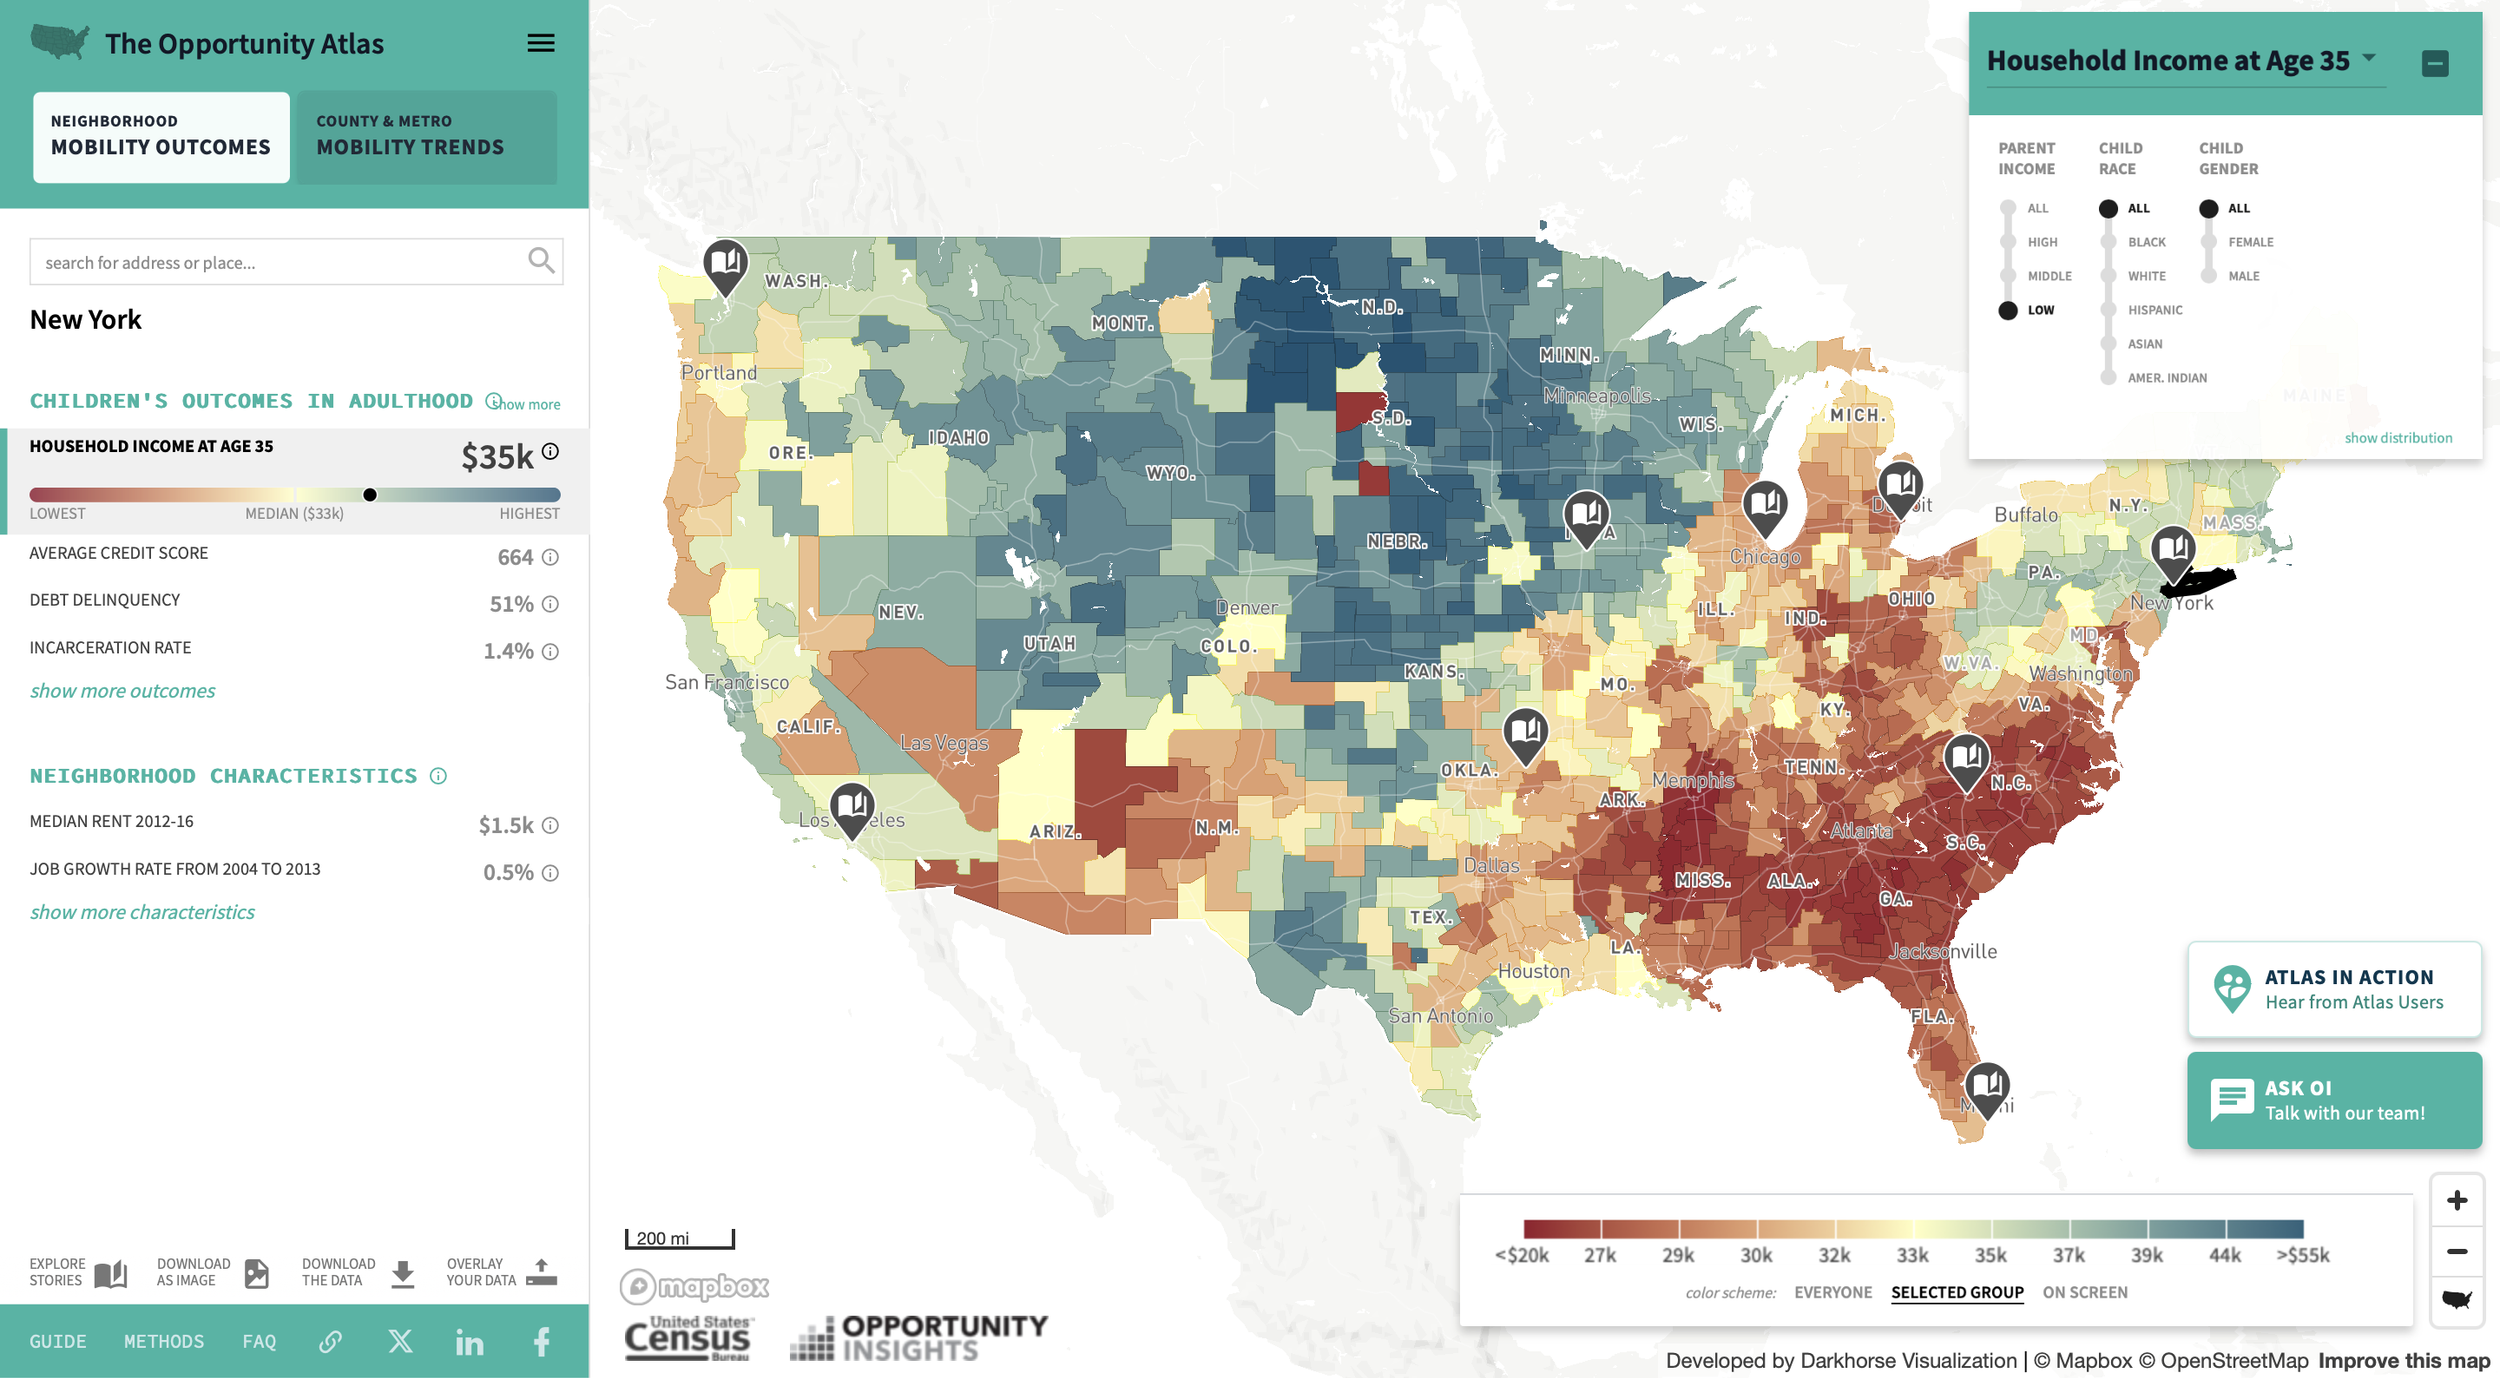
Instructions:
Open Opportunity Atlas → enter a city, county, state, or ZIP code in the search bar → zoom to a desired census tract or neighborhood → consult map layers and legends → click directly on a tract to view mobility and opportunity indicators → compare nearby tracts to identify geographic disparities in opportunity and neighborhood outcomes.